

Trades
The Trades widget provides a live feed of recent trades, showing transaction details such as time, price, and amount (as a coin quantity). By monitoring trade flow in real time, you can get valuable insights into market activity and sentiment.
Key Features of the Trades Widget
Real-Time Trade Display Shows recent trades, providing immediate information about market transactions.
Volume-Based Filtering Trades are categorized by USD value, allowing you to filter and focus on trades of a particular size (e.g., 10K, 100K, 1M, 10M USD).
Aggregated Trades Trades that occur within the same millisecond are aggregated. When this happens, the trade count appears in superscript.
Amount Indicator Each trade’s amount is represented by a bar, which scales proportionally to the selected category’s maximum or the highest amount in the list, making it easy to spot large trades at a glance.
Configure Currency Display Select "Base" or "USD" to force amounts to be displayed in USD or in the base currency of the market (or "Source" to disable the conversion). Toggle a "Short format" display of amounts (i.e. 1500 -> 1.5k).
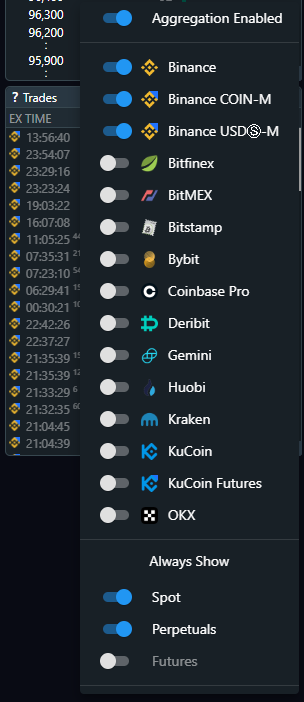
Exchange Aggregation You can choose to show trades only from custom Exchanges, so you will focus on the most important data.
Market Selection Override You can choose to show only Spot, Perpetuals, Futures trades or all together, depending on the market focus of your analysis. More about market types...

Why Inspecting the Trades Widget is Important?
Gauge Market Sentiment The Trades widget helps you see if buyers or sellers are dominating by analyzing the direction, size, and frequency of trades.
Spot Large Institutional Trades By setting volume filters, you can detect large transactions often associated with institutional activity, which can indicate strong buying or selling interest.
Track Market Momentum Monitoring the flow and volume of trades over time allows you to understand the strength of current price trends or potential reversals.
Understanding Trade Volume Significance for Different Thresholds
The Trades widget allows you to filter trades by volume, which is valuable for identifying different types of market participants and trade impact levels. The different USD categories have an impact depending on the liquidity and volume of the market.
Let’s see some categories using the example of the highly liquid BTC market:
1K - 10K USD Trades These smaller trades are most common for retail trading activity and can indicate rising retail interest but cannot impact the price heavily.
10K - 100K USD These medium range trades are common in both retail and small-scale trading activity. Although they may not significantly impact price, an increase in frequency or volume of these trades can indicate rising retail interest in the asset.
100K - 1M USD Trades within this range usually involve larger traders or smaller institutions. Consistent volumes in this range suggest growing interest among more prominent players, potentially leading to price shifts.
1M - 10M USD High-value trades in this category are typically made by institutional investors, whales, or funds. Significant activity at this level can drive market direction, especially in less liquid markets.
10M USD and Above Massive trades of this size can dramatically impact price and indicate substantial interest or capital flow. Watching for repeated trades in this range can signal strong market moves or large investors making calculated entries or exits.
Fixed filter
Filter trades by simple traded volume size.

Dynamic filter
This mode lets you filter trades by size dynamically.
Every 24 hours, the average trade size is calculated for all markets. This average is then used to determine the size category that is going to be used for filtering.
Using this average, you can filter trades by size dynamically. This means that each market has its own average trade size and therefore its own filter.

Key Volume Thresholds for Different Trading Styles
Intraday Traders Focus on 10K - 1M USD trades to capture real-time retail and medium-sized institutional activity that may influence short-term price trends.
Swing Traders Watch for 1M - 10M+ USD trades to identify larger institutional interest or long-term sentiment shifts that may define the asset’s medium-term direction.
Step-by-Step Setting Up the Trades Widget
Choose Market Types
Spot Market Best for analyzing trades based on the current, tangible market price. Spot trading activity often reflects immediate demand.
Perpetuals Market Focus on perpetuals to see leveraged trades, which are common in high-frequency, speculative trading.
Futures Market Watch classic futures trades.
Step-by-Step Inspection Strategy (BTC example)
Identify Key Support and Resistance with Large Volume Trades
Large trades at certain price levels (like 1M USD+ trades) can help identify strong support (if trades are buys) or resistance (if trades are sells). These levels often reflect institutional interest and can act as psychological price boundaries.
Track Volume Patterns with Time and Price
Watch how large trades develop over time relative to price changes. If large volume trades appear as price approaches a level of known resistance, it may indicate potential selling pressure. Conversely, large trades on dips can signify buying interest at support.
Conclusion
By understanding the significance of each trade volume level, setting appropriate filters, and observing trade patterns over time, you can gain a clearer view of market activity and make better-informed trading decisions. The Trades widget, with its live updates and volume-based filters, becomes an invaluable tool for tracking real-time sentiment, institutional interest, and potential price movements.
Last updated