LogoLogo
ConsoleScreener
  • Getting Started
    • Welcome
    • 📊Why TRDR?
  • Key Features and Indicators
    • 📚Order Book Indicators
      • Order Book Depth
      • Order Book Depth Overlay
      • Order Book Top Levels
      • Order Book Depth Totals (Liquidity)
    • 💬Sentiment Indicators
      • Open Interest / Open Interest Delta
      • Long/Short Ratios
      • Liquidations
      • Funding Rate
    • 📊Volume Indicators
      • Volume By Side
      • Cumulative Volume Delta (CVD)
    • Indicator Overrides
    • Metrics
    • Screener
    • ⏰Alerts
      • Alerts Console
      • Creating an Alert
      • Ready-to-Use Alerts
      • RSI Alert Example
      • Range Breakout Alert Example
      • FAQ
    • Widgets
      • Order Book
      • Order Book Depth
      • Order Book Changes
      • Alerts
      • Trades
      • Price Range
      • Bid /Ask Range
      • Watchlist
    • 🗄️Templates
    • 🖥️Layouts
    • 📈Multi Charts
    • FAQ
Powered by GitBook
On this page
  • CVD Types
  • CVD Settings
  • How to Use CVD in Trading?
  • Simple Strategies for Using CVD
  • 1. Movement Confirmation (Both CVDs vs. Price Convergence)
  • 2. Reversal or Exhaustion Detection (Spot CVD vs. Price)
  • 3. Fake Move Detection (Spot CVD vs. Perpetuals CVD)
  • 4. Range-Based Hidden Buying/Selling
  • 5. Uptrend/Downtrend Absorption
  • Key Takeaways:
  1. Key Features and Indicators
  2. Volume Indicators

Cumulative Volume Delta (CVD)

PreviousVolume By SideNextIndicator Overrides

Last updated 1 month ago

Volume is a critical component of market movement — without it, price lacks the necessary liquidity to fluctuate. It originates from two primary sources:

  • Market Orders (Taker Orders) — Aggressive orders that execute at the current market price.

  • Limit Orders (Maker Orders) — Passive orders that remain in the order book until price reaches them.

The Cumulative Volume Delta (CVD) indicator is a tool for analyzing market order flow by tracking the difference between aggressive buying and selling activity over time:

  • If CVD is increasing, it means more people are buying aggressively (bullish signal).

  • If CVD is decreasing, it means more people are selling aggressively (bearish signal).

CVD Types

There are two main types of CVD:

  1. Spot CVD — Measures buying and selling volume on spot markets.

  2. Perpetuals CVD — Measures buying and selling volume on futures markets (perpetual contracts).

By comparing them, you can understand if price moves are supported by real buying (spot) or just leverage (futures).

TRDR offers customizable views of volume data, including:

  • Buy vs. Sell Segmentation — Identifies whether trades are executing at the bid or ask.

  • Delta (absolute difference) — Highlights buy/sell imbalances per time interval.

  • Cumulative Delta — Aggregates buy/sell imbalances over time to track sentiment shifts.

  • Delta Aggregation Across Exchanges — Provides a broader view of market behavior across multiple venues.

CVD Settings

CVD settings are highly dependent on the selected timeframe and your trading style (scalping, intraday, swing or long-term).

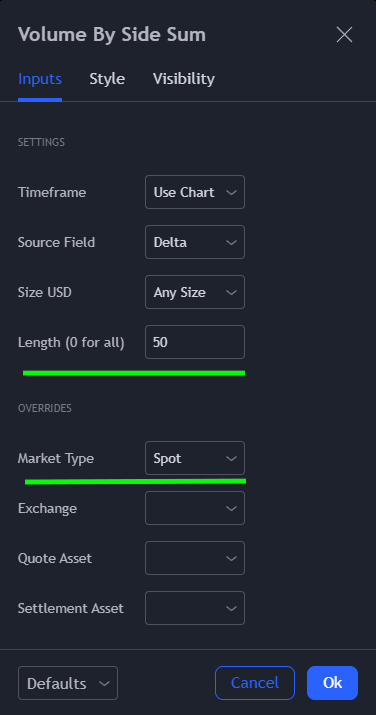
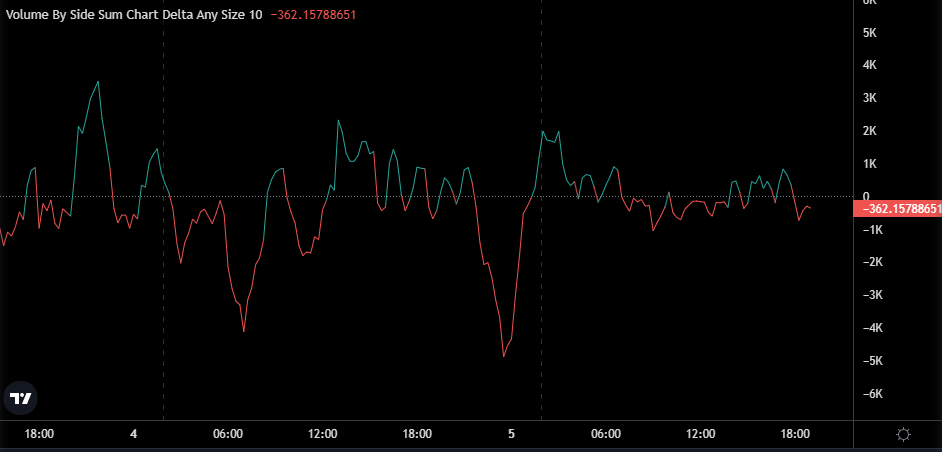
  • The Accumulation Length — there is no "perfect" length, but generally it is recommended to set it to about 3-5 times more than the selected timeframe (E.g.: 30, 40 or 50 for 10m timeframe). We strongly recommend that you try different CVD lengths to find the one that works best for your trading style.

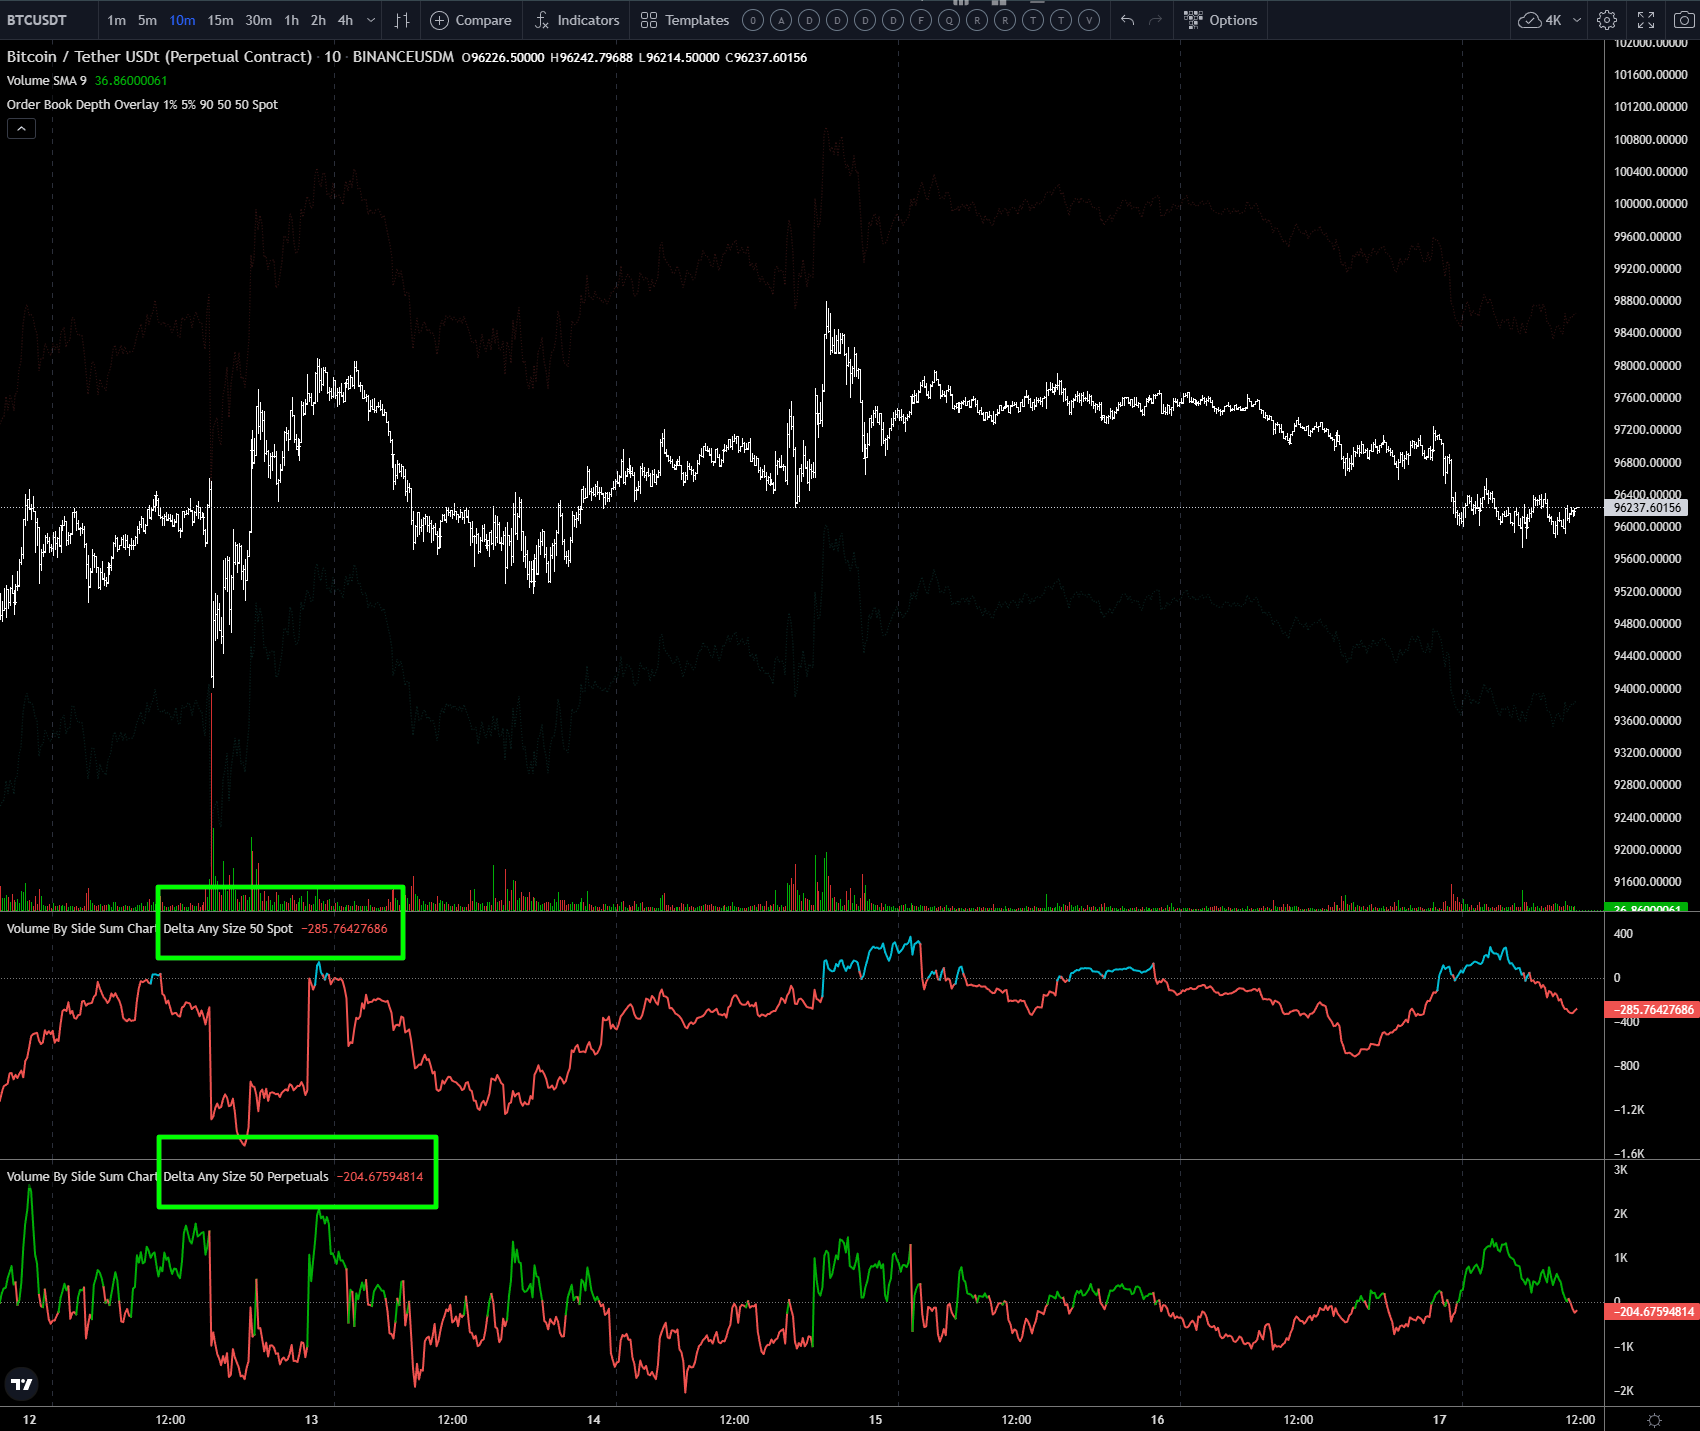
  • Always display Spot CVD and Perpetuals CVD separately to compare them. Never merge them together!

How to Use CVD in Trading?

  • Always compare Spot CVD and Perpetuals CVD.

  • Look for divergences between price and CVD.

  • Use CVD with other indicators (like Open Interest and Funding Rates).

  • Avoid trading against Spot CVD trends.

Simple Strategies for Using CVD

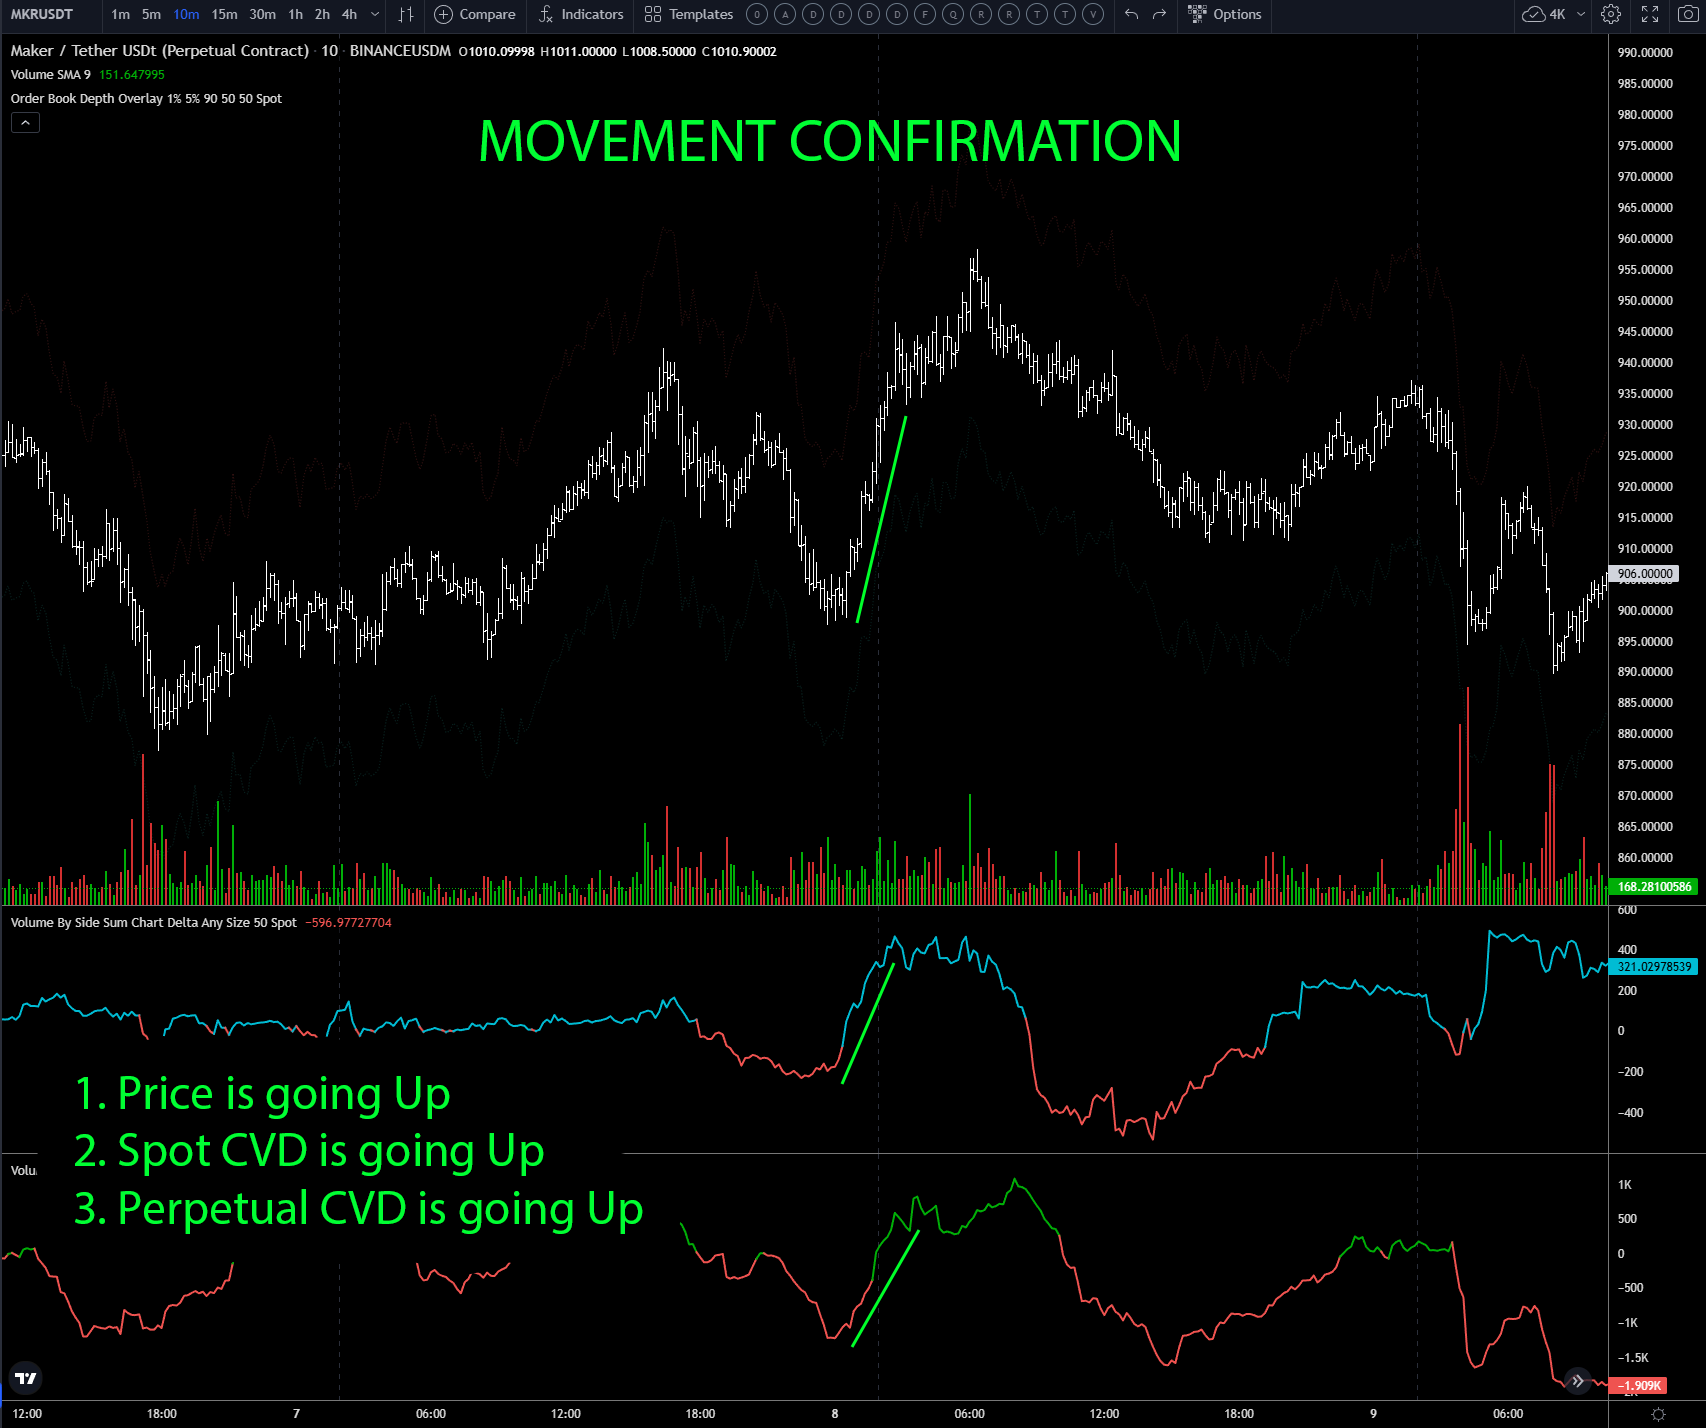
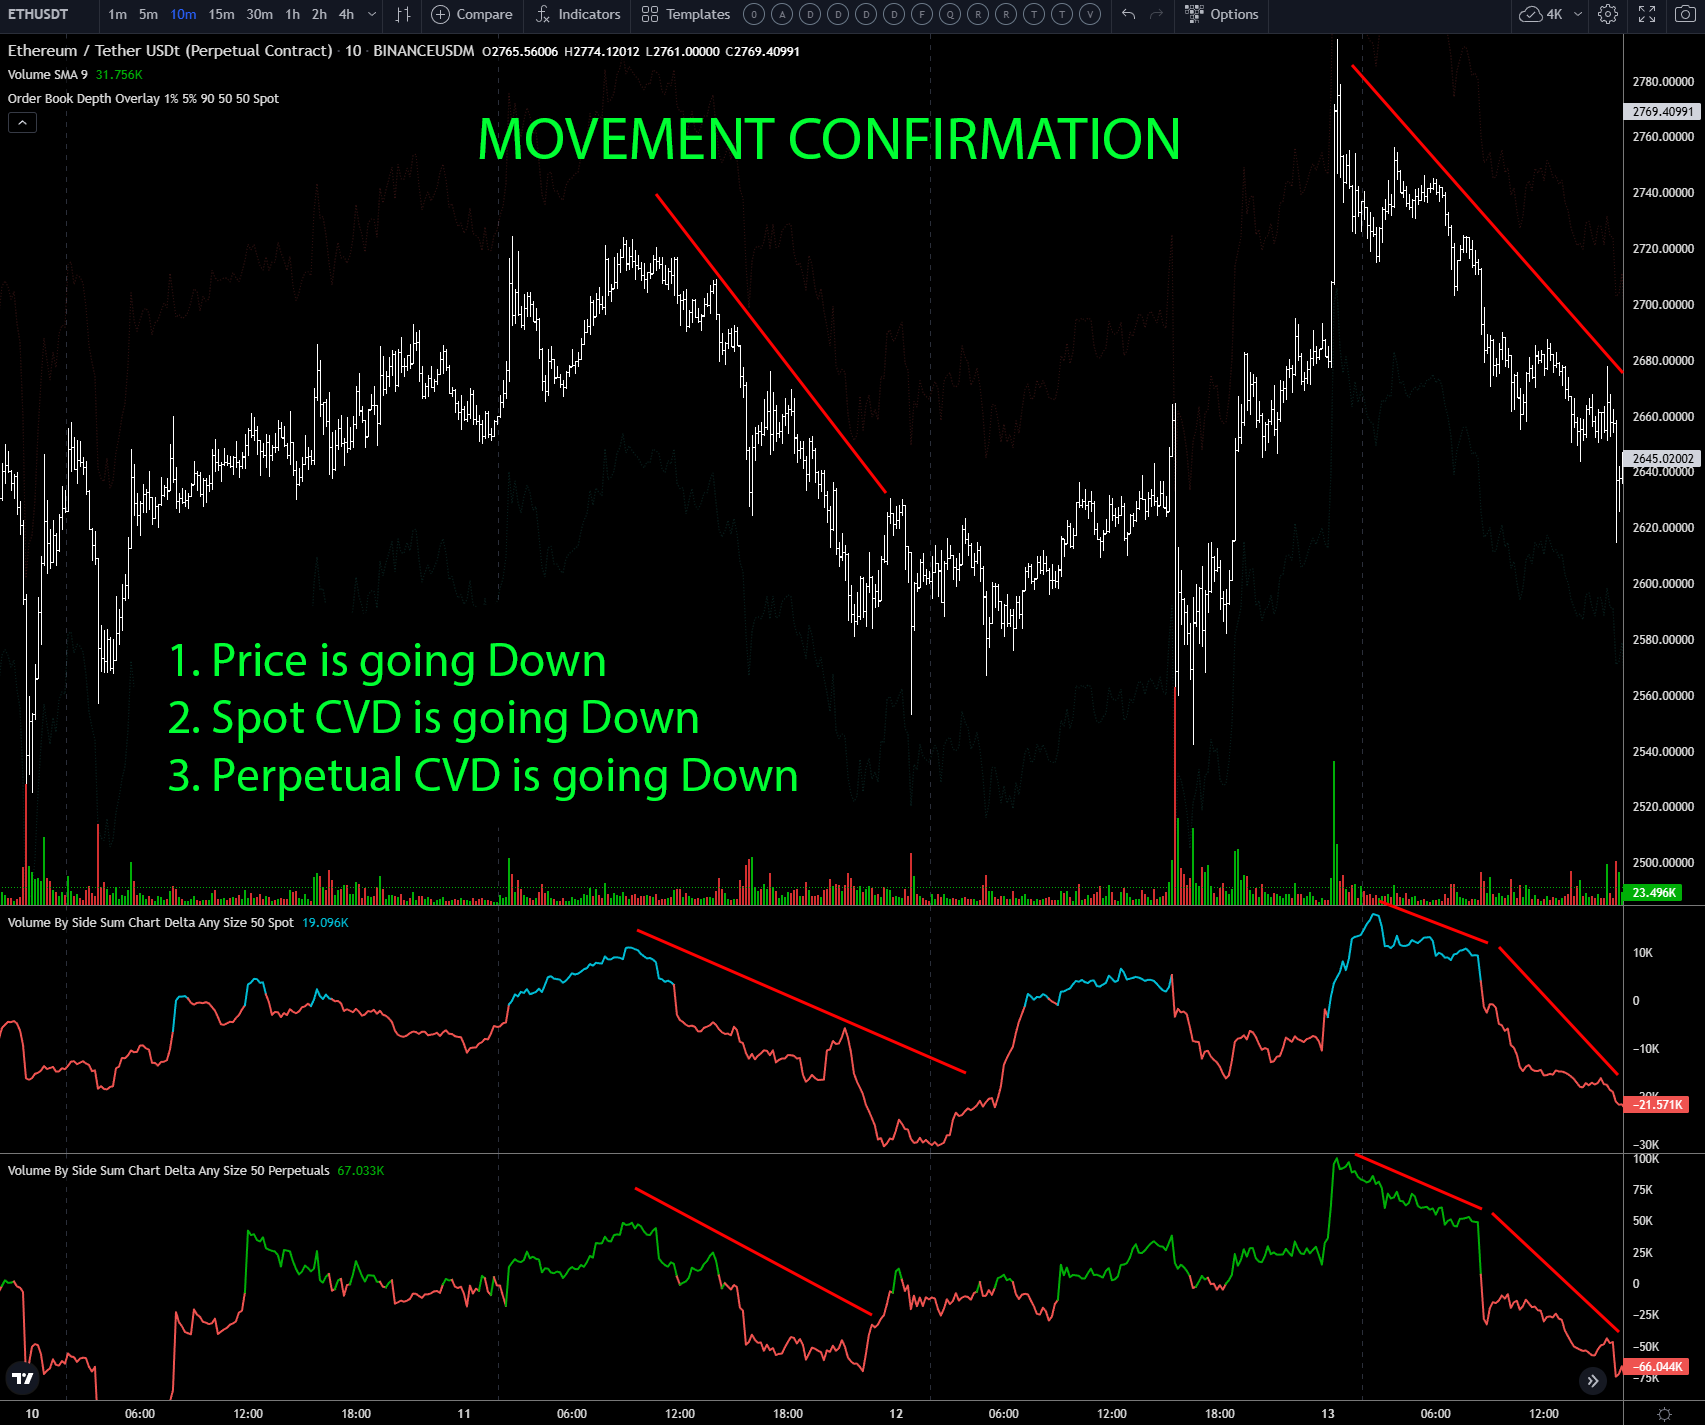
1. Movement Confirmation (Both CVDs vs. Price Convergence)
Bullish example: when price makes a new High and both Spot and Perpetuals CVD are rising, it signals good buying sentiment.

Bearish example: when price makes a new Low and both Spot and Perpetuals CVD are going down, it signals good sell sentiment.

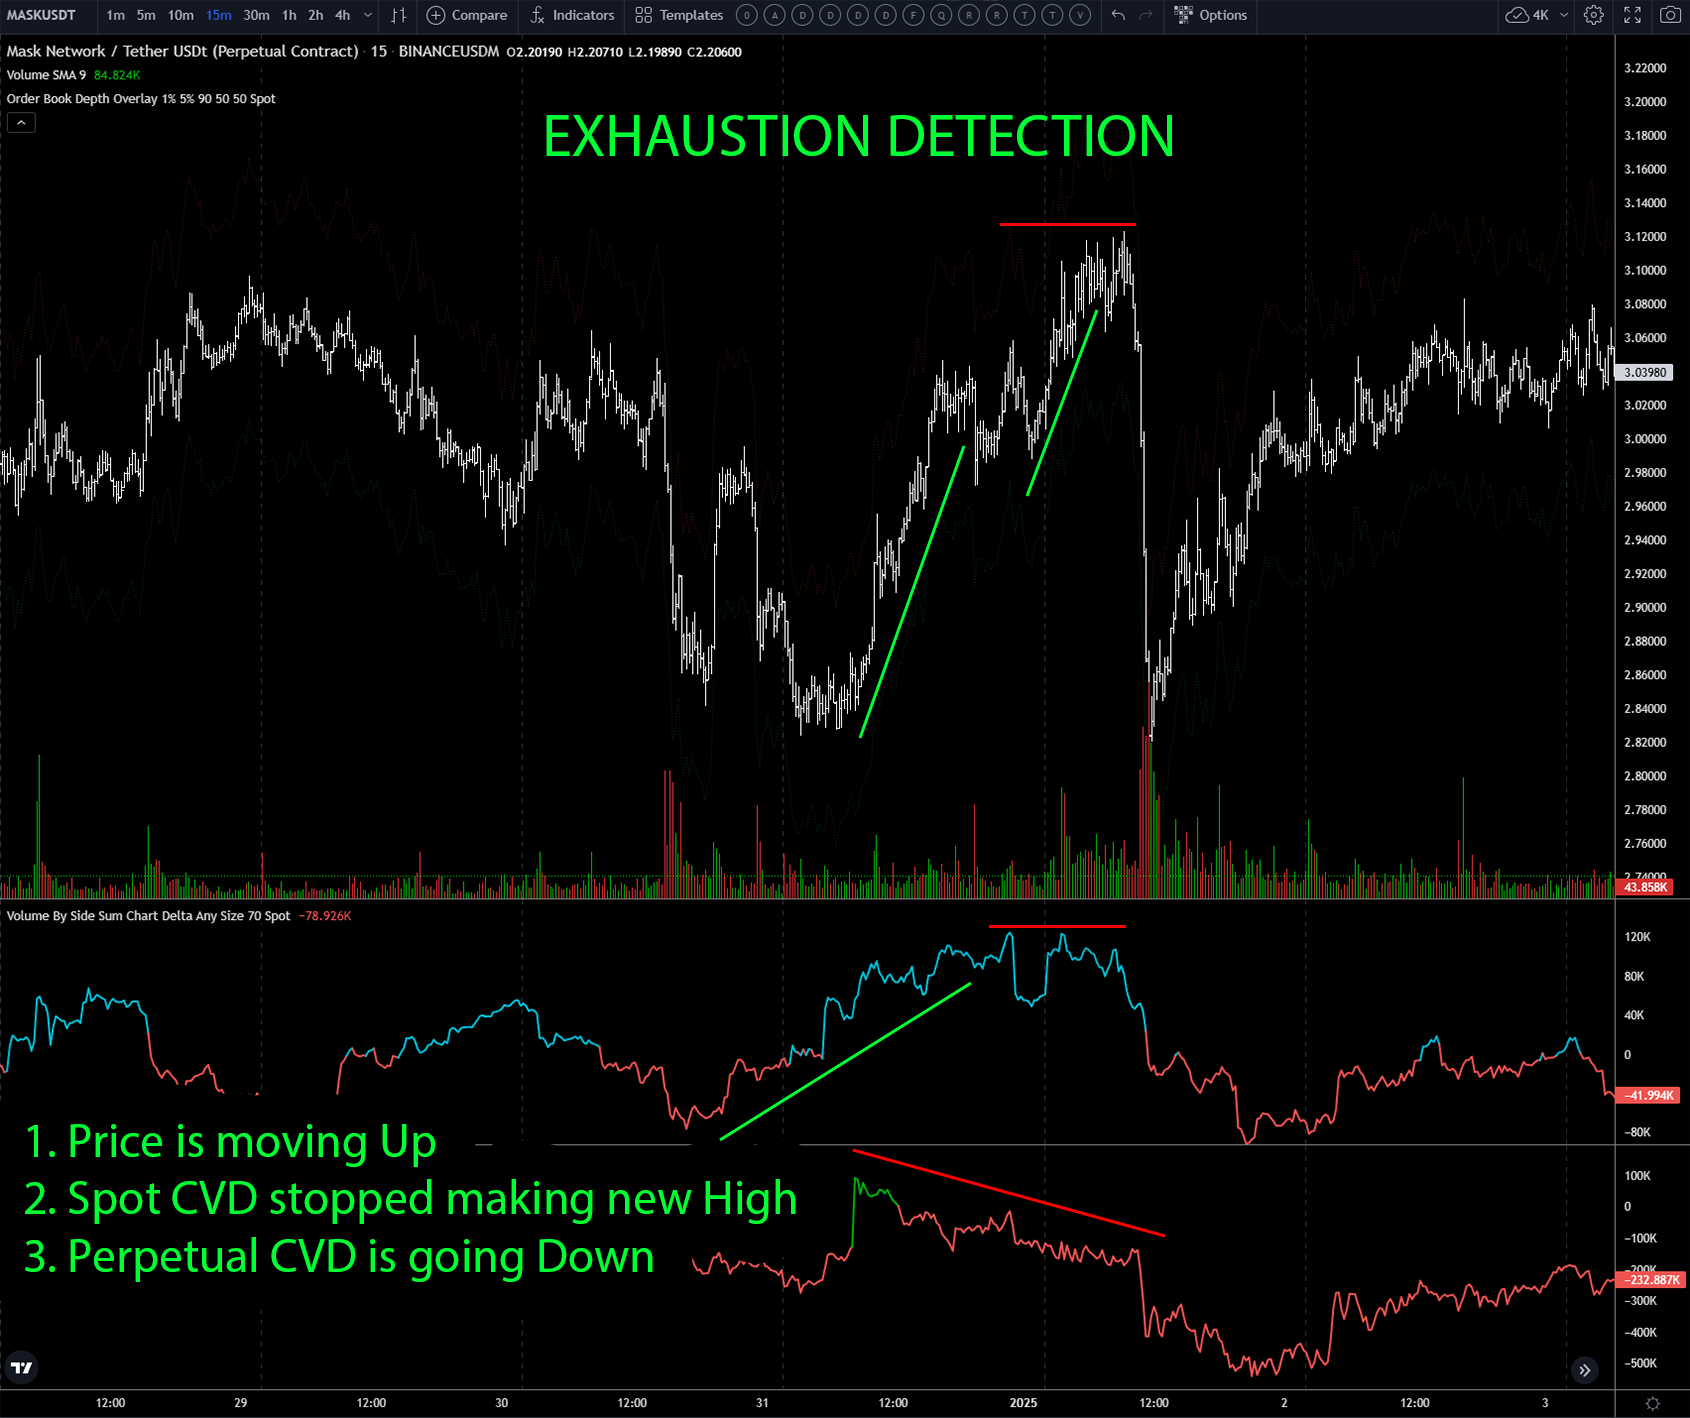
2. Reversal or Exhaustion Detection (Spot CVD vs. Price)
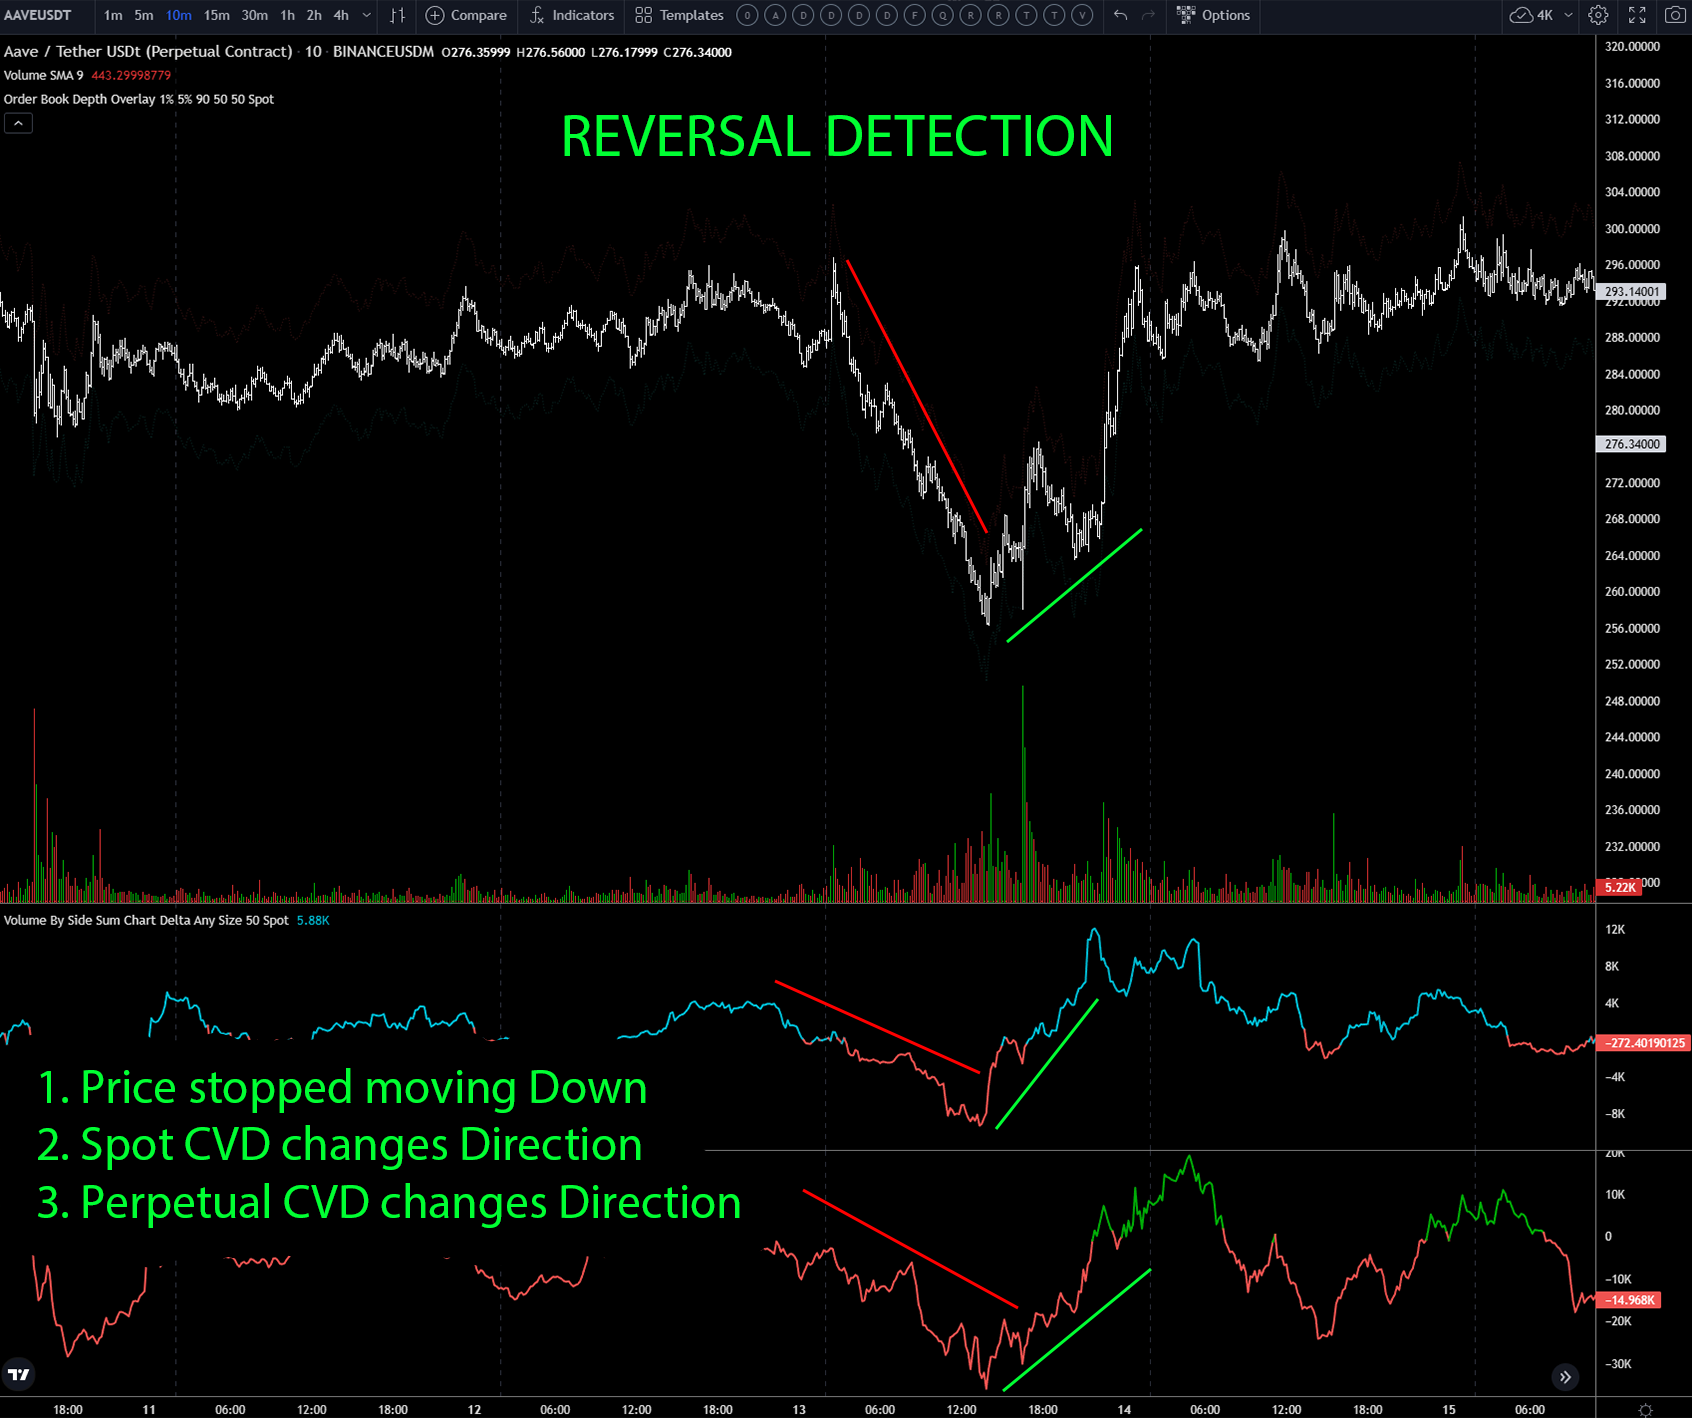
Bullish example: when price makes a new Low, but Spot CVD does not (or changing its direction), it signals weak selling pressure (movement reversal or exhaustion is possible).

Bearish example: when price makes a new High, but Spot CVD does not (or changing its direction), it signals weak buying pressure (movement reversal or exhaustion is possible).

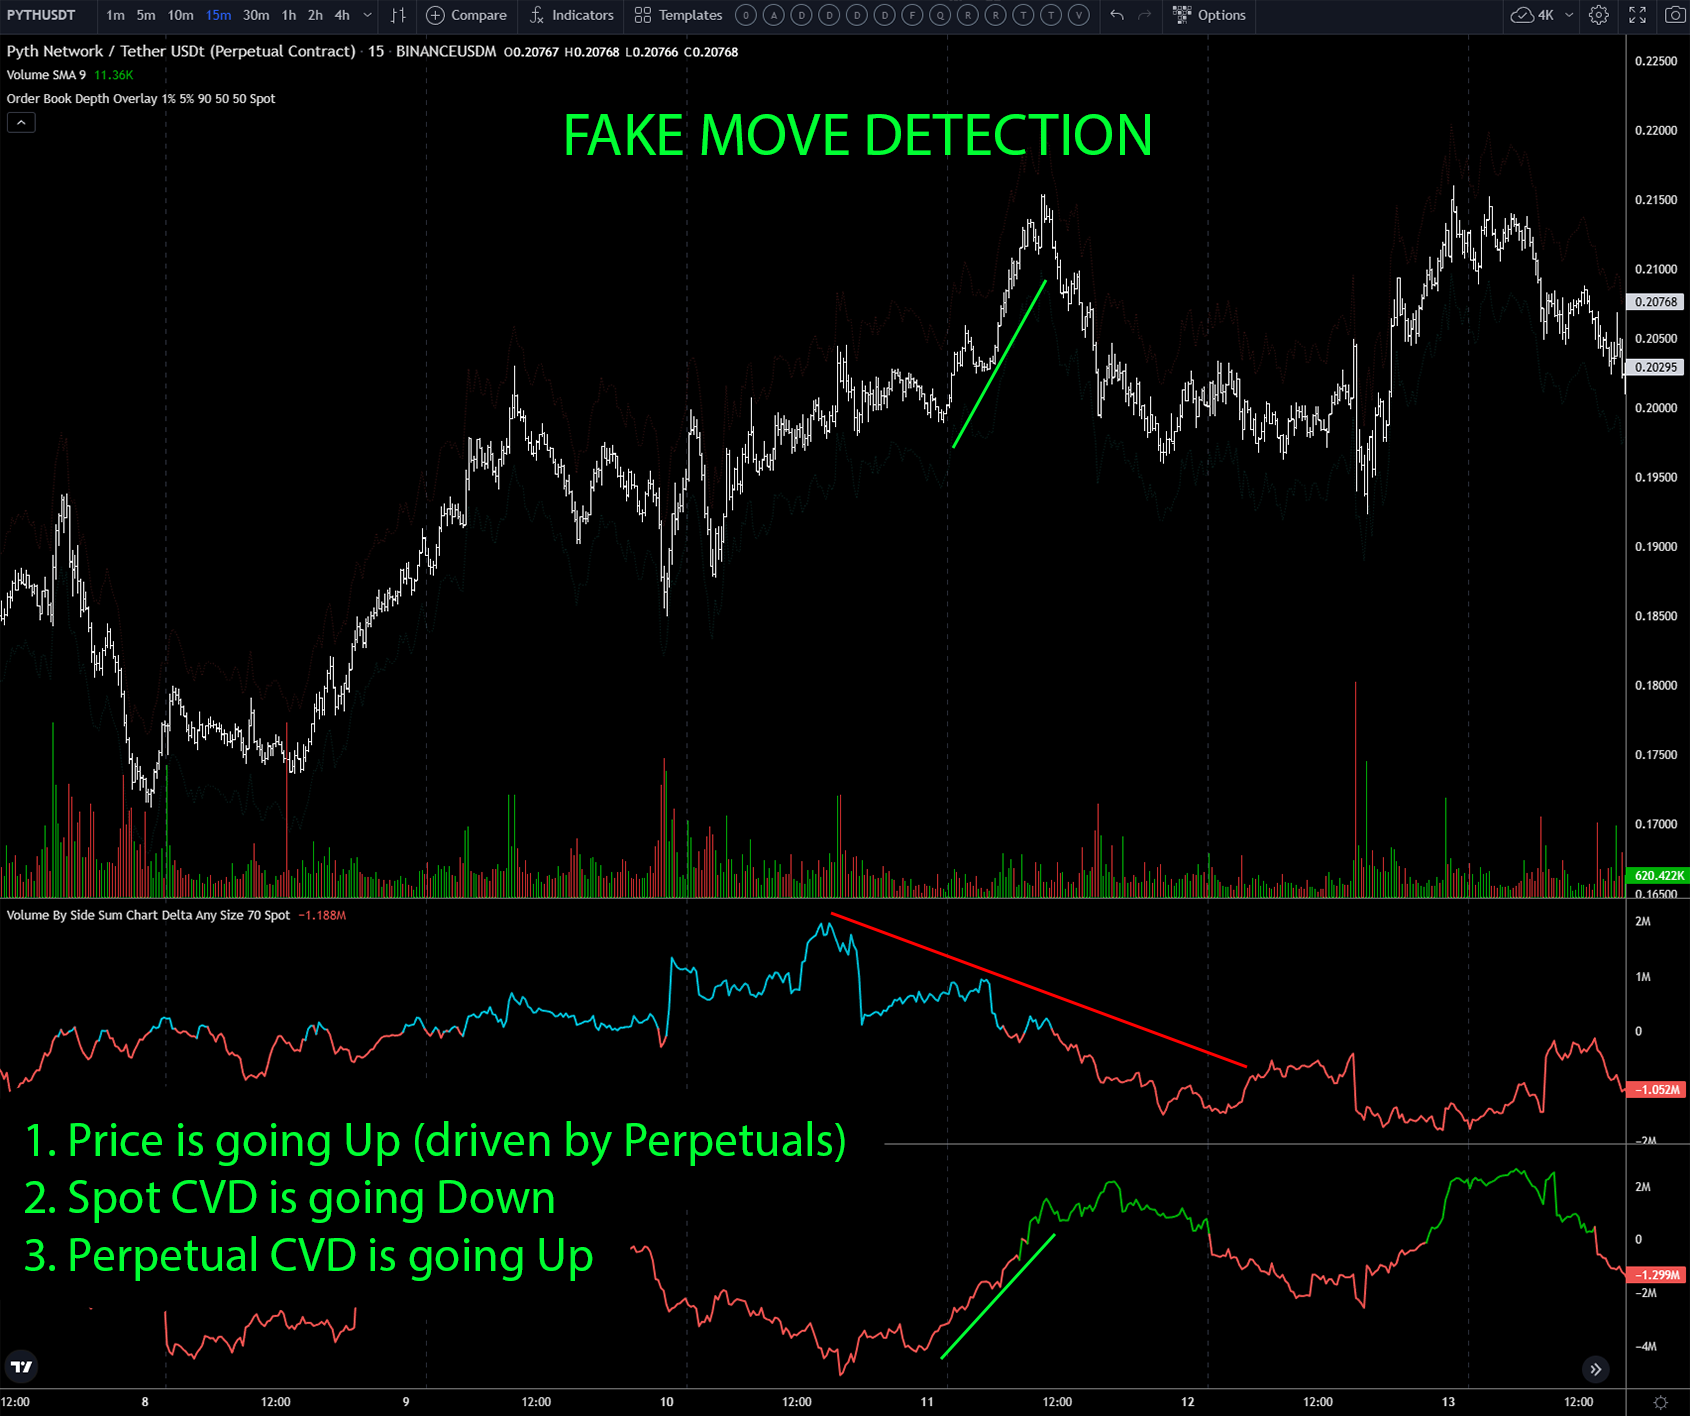
3. Fake Move Detection (Spot CVD vs. Perpetuals CVD)
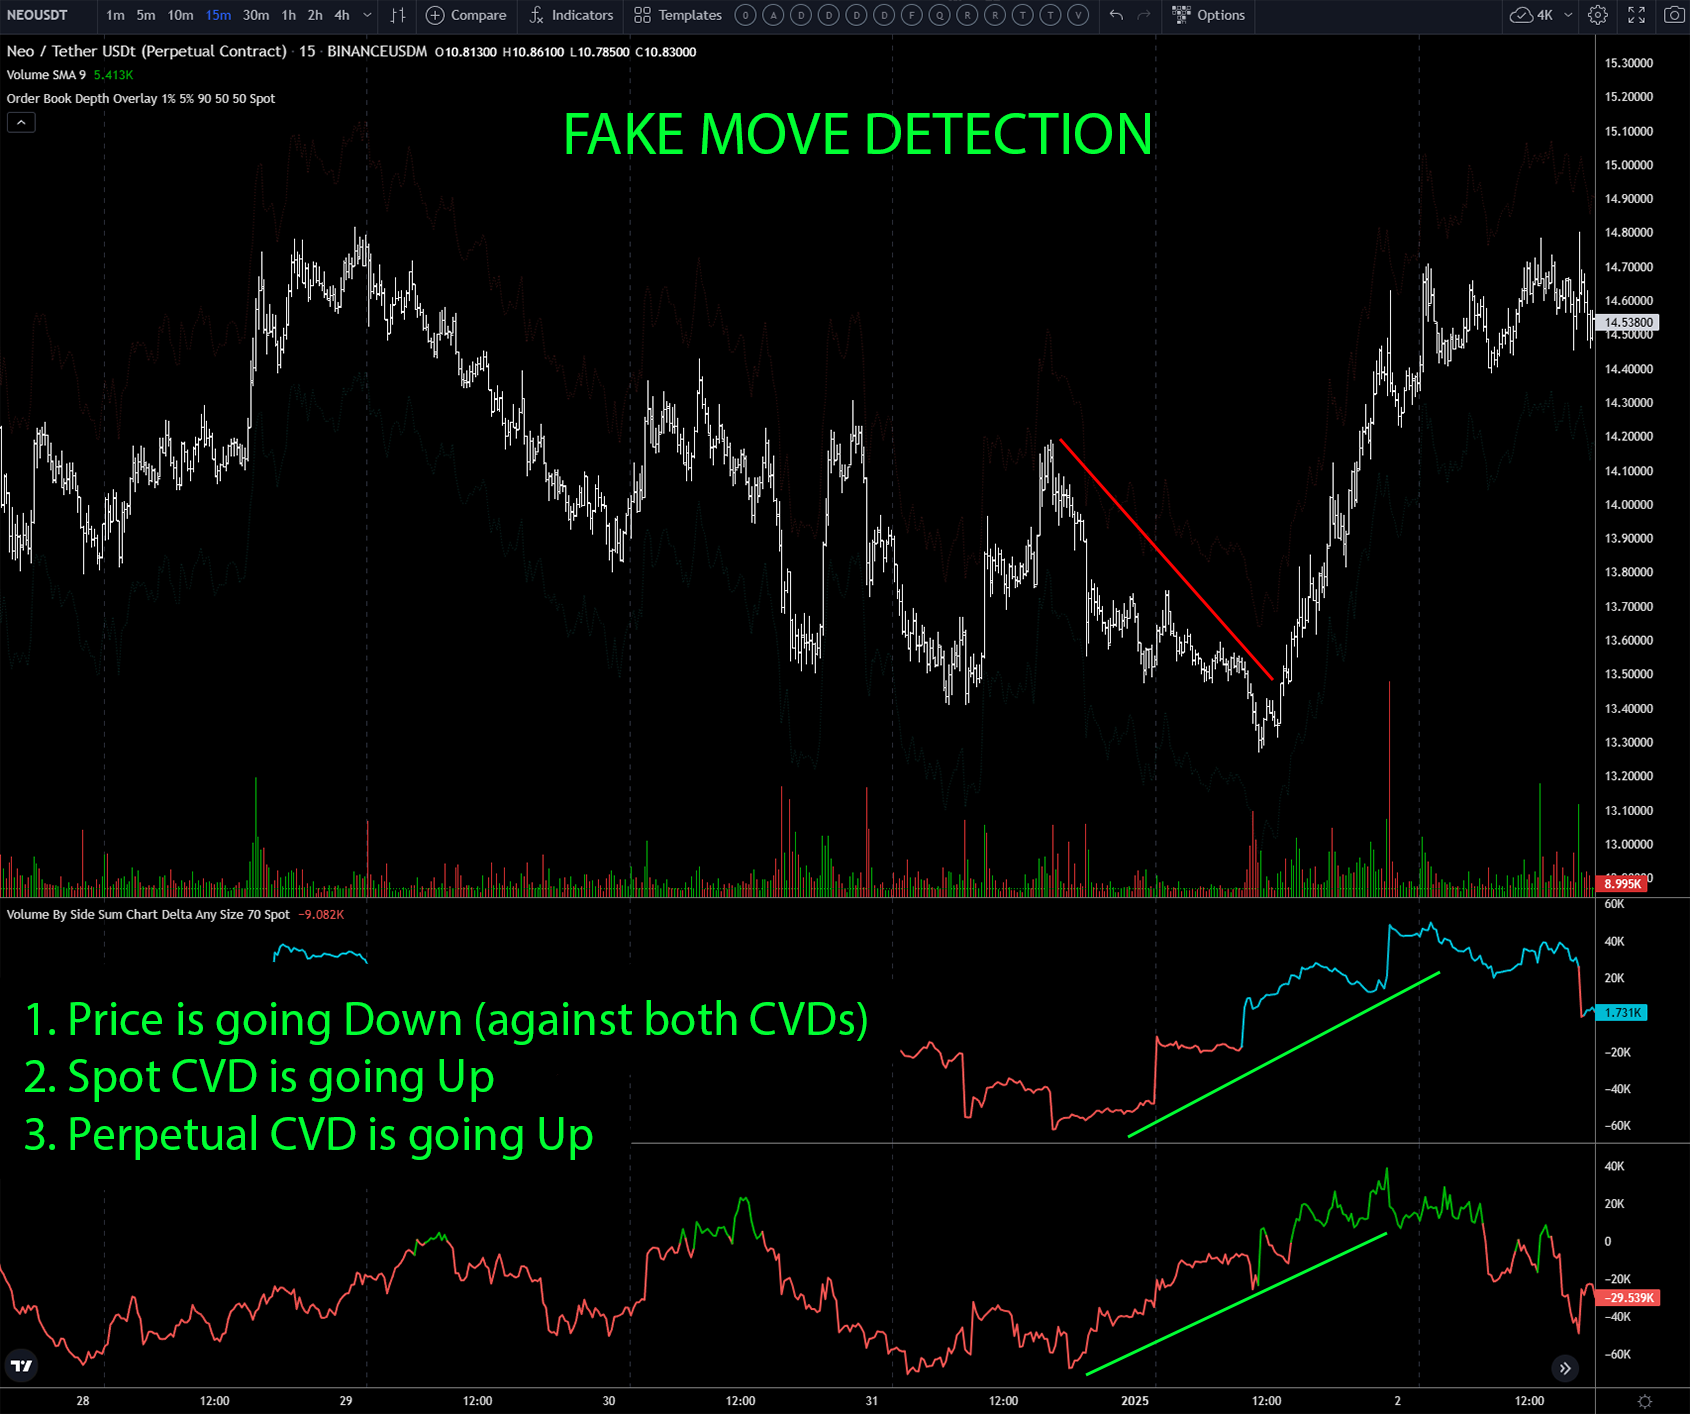
Bullish example: if the price is going Down, but Spot and Perpetuals CVDs are going Up, it means the move is driven by futures leverage, not real selling. This is often a fake dump, and the price may soon rise (Bears Trap).

Bearish example: if the price is going Up, but Spot CVD is going Down, it means the move is driven by futures leverage, not real buying. This is often a fake pump, and the price may soon drop (Bulls Trap).

4. Range-Based Hidden Buying/Selling

Bullish example: If the price forms a range and CVD is rising inside of the range, it means market buys are prevailing — possible Up movement from this zone (Hidden Buying).

Another Bullish example:

Bearish example: If the price forms a range and CVD is going down inside of the range, it means market sells are prevailing — possible Down movement from this zone (Hidden Selling).

5. Uptrend/Downtrend Absorption

Uptrend absorption example: If CVD is making new highs, but price isn't, this shows that there is a lot of activity from aggressive buyers trying to push the price higher, but their market buy orders are getting absorbed by limit sell orders — could indicate a trap for buyers and possible continuation of the downward movement.

Downtrend absorption example: If CVD is making new lows, but price isn't, this shows that there is a lot of activity from aggressive sellers trying to push the price lower, but their market sell orders are getting absorbed by limit buy orders — could indicate a trap for sellers and possible continuation of the upward movement.

Key Takeaways:

  • Spot CVD rising → Real demand, bullish.

  • Perpetuals CVD rising without Spot CVD → Fake move, potential short.

  • Price rising, but CVD not → Weak move, possible reversal.

  • CVD rising, price flat → Accumulation, bullish signal.

  • Price breaks resistance, but CVD weakens → May signal a false breakout.

  • Strong CVD support at breakout levels → The price is likely to keep moving in the same direction.

📊
Cumulative Volume Delta (CVD)
Example of Length for 10m timeframe on Spot market
Always display separately Spot CVD and Perpetuals CVD. Never merge them together!
MKR: Movement Confirmation (Bullish CVD Convergence)
ETH: Movement Confirmation (Bearish CVD Convergence)
AAVE: Reversal Detection
MASK: Exhausting Detection
NEO: Fake Down Movement Detection
PYTH: Fake Up Movement Detection
MKR: Hidden Buying Detection
ACT: Hidden Buying Detection
BAKE: Hidden Selling Detection
ATOM: Uptrend Absorption
RENDER: Downtrend Absorption