Order Book Depth Overlay

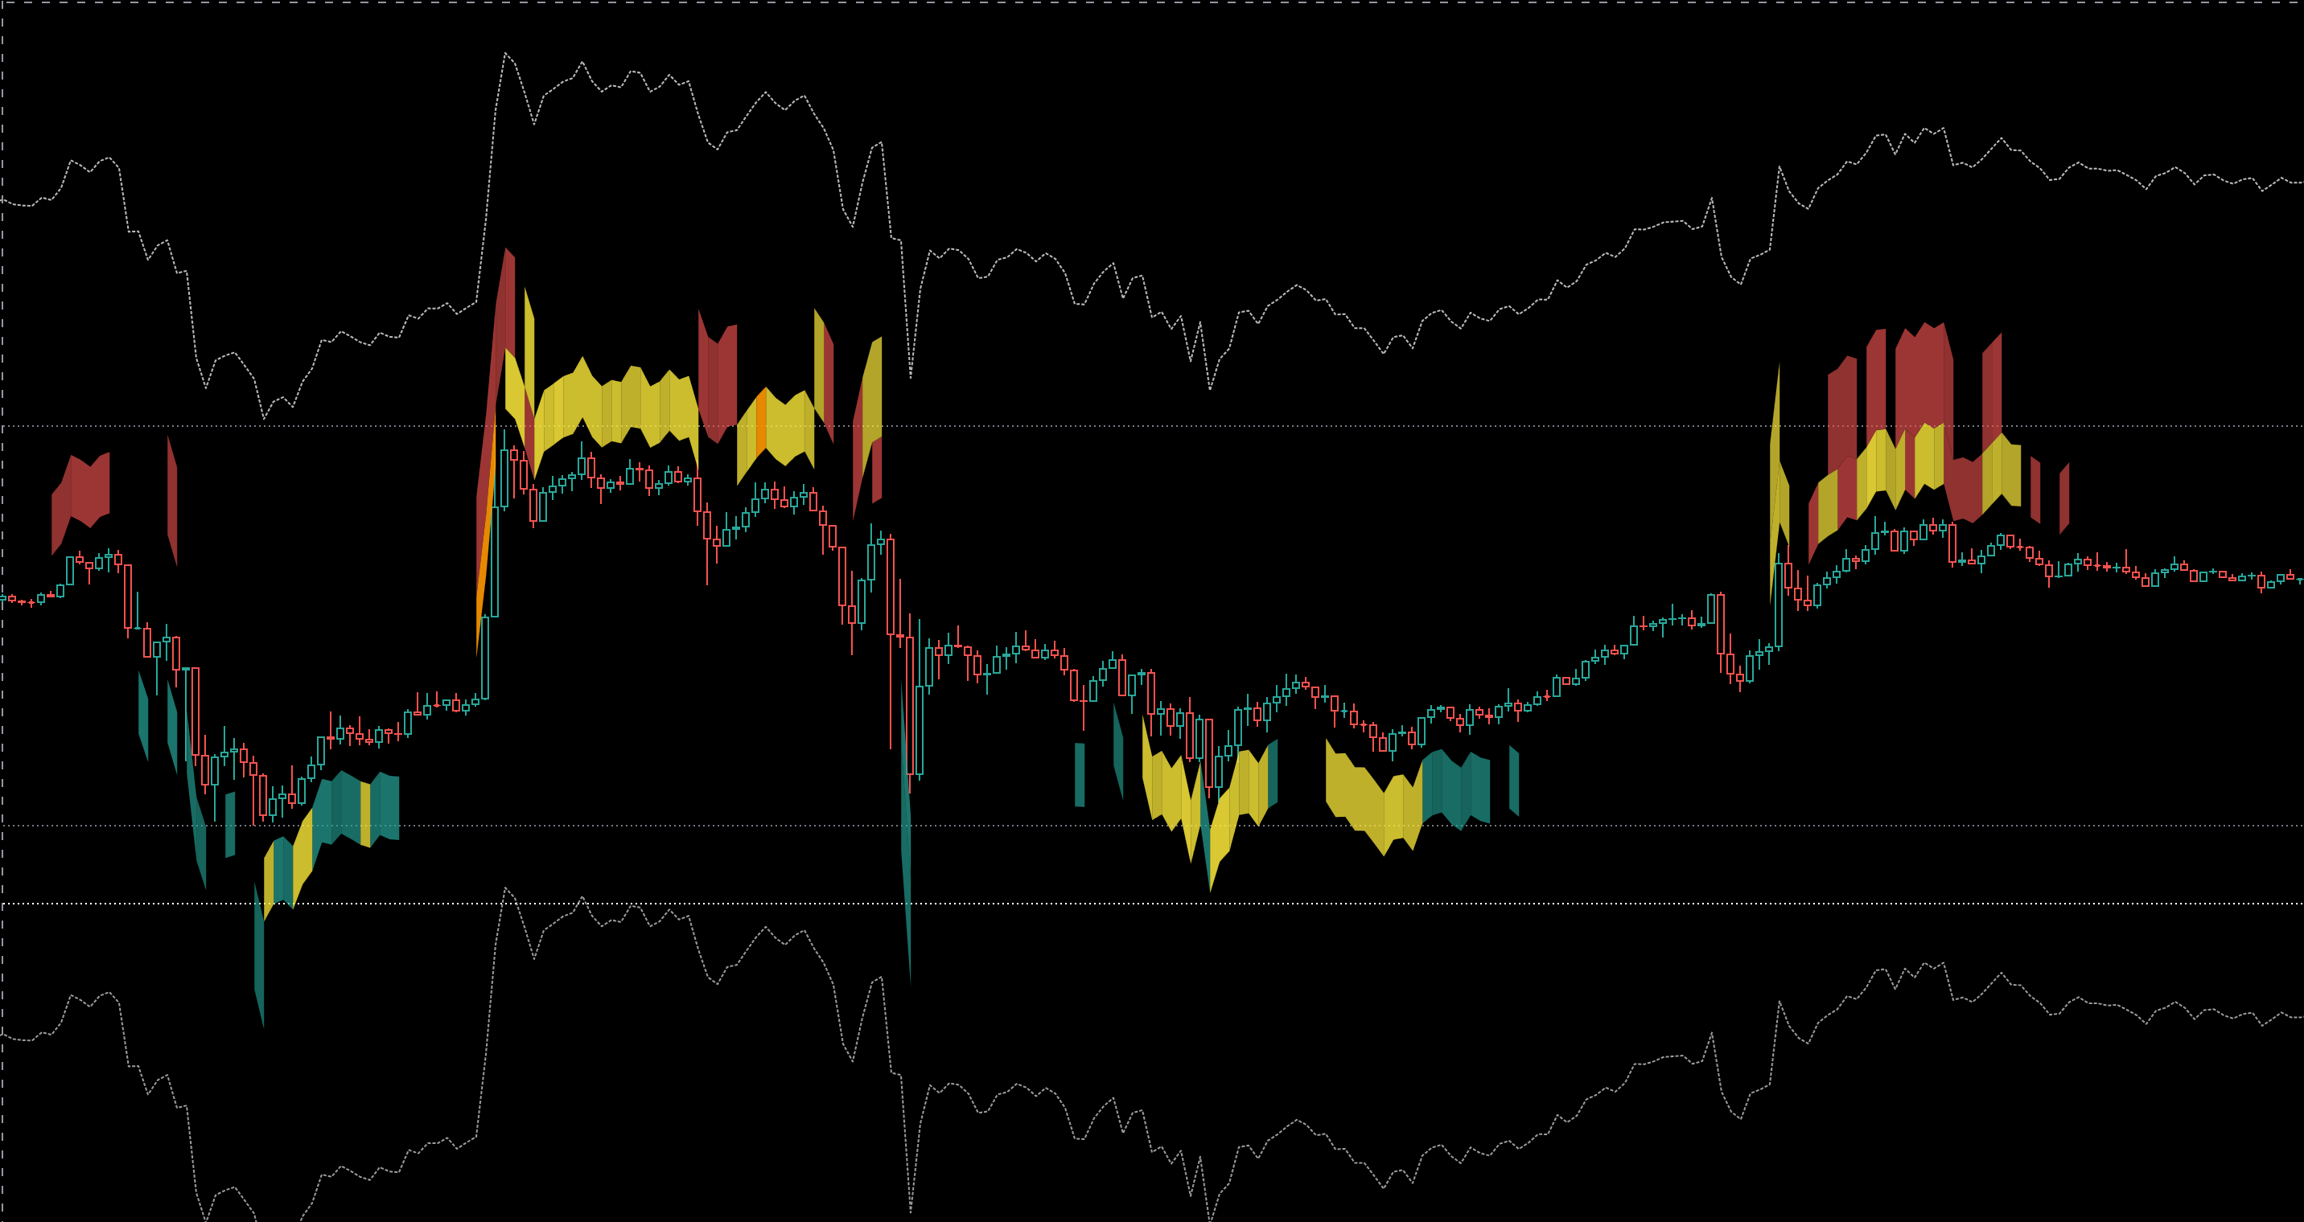
The Order Book Overlay is an advanced visualization tool, designed to provide traders with a clear and structured representation of market liquidity. By overlaying key order book data on Chart, it allows for a precise analysis of bid-ask imbalances, liquidity shifts, and potential market turning points.
Purpose of the Overlay
The Overlay serves as a graphical representation of Order Book Depth, highlighting liquidity zones based on a ratio-driven model. This approach helps traders:
Candle-Based Printing Mechanism
The Overlay uses candle-close-based data printing, ensuring reliability in ratio analysis:
A ratio value (e.g., 60) must be maintained until the close of the selected timeframe (e.g., 15M candle) to be displayed.
This prevents misleading signals caused by temporary liquidity spikes or spoofing activity.
Practical Use Cases for Traders
🔹 Spotting Hidden Liquidity – Detect areas where significant orders are accumulating. 🔹 Confirming Breakouts & Reversals – Compare overlay shifts with price action.
By integrating the Order Book Overlay with TRDR’s other market depth indicators, traders gain a deeper understanding of liquidity behavior, enhancing execution timing and trade accuracy.
Let’s start with the basics:
Key Inputs:

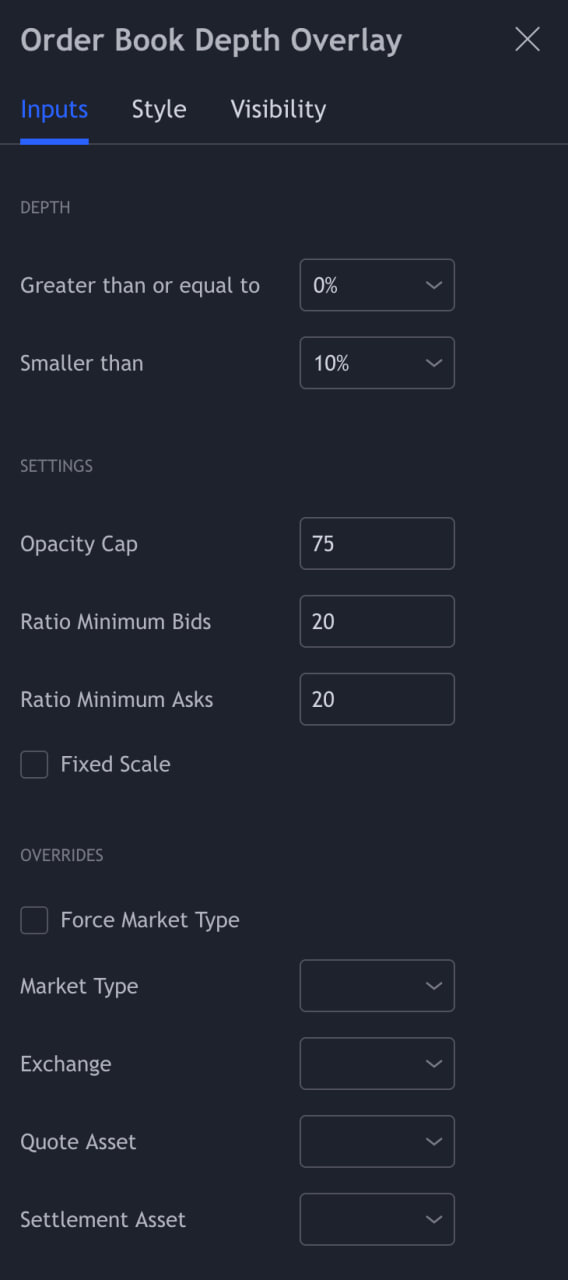
Opacity Cap: Adjust the density of overlay colors to your preference.
Ratio Minimum Bids: Set the threshold below which bids won't appear on the overlay.
Ratio Minimum Asks: Set the threshold below which asks won't appear on the overlay.
Fixed Scale: Designed to make the scale wider for time frames below 15 minutes. If you want to view the overlay on a 30 second time frame for example, it will help to widen the scale.
OVERRIDES
OVERRIDESForce market type: All indicators have their market type and / or exchange overridden. For example, you could use the overlay indicator and set market type to "Perpetuals" and exchange to "Binance Futures" and it would stick to that, regardless of which pair you select. But if you just select perpetuals it will only show on a perpetual market. The ratios on spot markets are usually higher compared to perpetual markets. Why? Because the books are thicker (more liquid) on perpetual markets.
Market Type: Selection tool for different markets: Spot, Perpetuals, Futures. More about market types...
Exchange: Choose between different exchanges.
Quote Asset: A quote asset, is one of the two assets involved in a trading pair. It is the second asset listed in the pair and is used to determine the price of the first asset, known as the base asset. Together, these two assets make up a trading pair. The quote asset is essentially the unit of measurement for pricing the base asset. When you see a trading pair like BTC/USD, where BTC is the base asset and USD is the quote asset, it means that the price of one Bitcoin is determined in terms of U.S. Dollars. In other words, if you want to buy or sell Bitcoin, you'll use U.S. Dollars as the reference currency to determine its value.
Settlement Asset: Settlement assets play a crucial role in finalizing and confirming transactions and ensuring that ownership of the traded assets is transferred between parties. Here are some examples of settlement assets in the cryptocurrency space: Spot: Select only spot markets for this indicator. Base: (COINM): COIN-margined contracts are denominated and settled in the underlying cryptocurrency. Quote: (Fiat & Stablecoins): USDT-margined contracts are denominated and settled in USDT.
Overlay Configuration
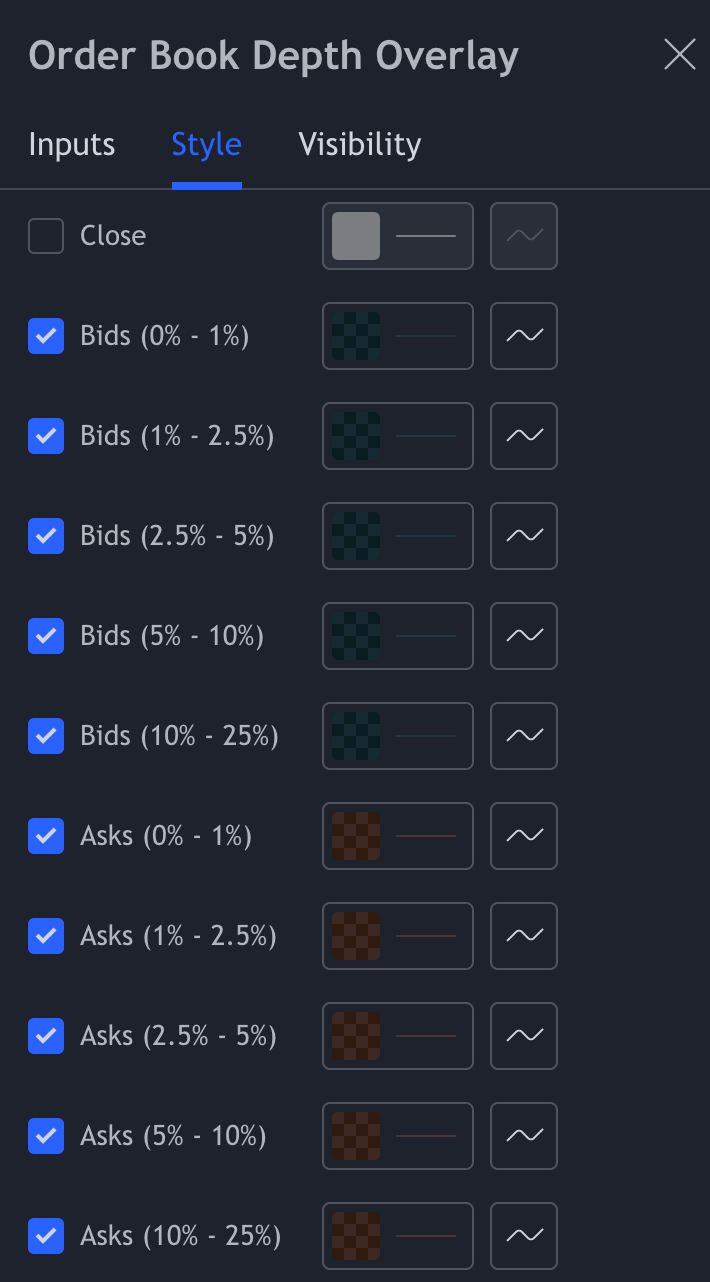
Choose the depth range you want to adjust, such as 0-2.5%. Adjust Style: Customize the style to your liking, including colors and bands. You can enable or disable specific elements.
The default settings are Ratio Minimum Bids: 20, Ratio Minimum Asks: 20.
Select Depth: Choose the depth range you want to adjust, such as 0-2.5%. Recommended is 0-10%.
Adjust Ratios: Fine-tune the ratios to filter out noise and display only the most relevant signals. Default settings are Ratio Minimum Bids: 20, Ratio Minimum Asks: 20.
Overrides: Specify a market type of exchange for your configuration.
Style
Select Bands: Select which depth lines you want to see. If you select a depth of 0-10% but turn of the 0-10% the bands. The indicator scale will change. If you like to have the bands at a true distance make sure you turn on the widest depth. In this case with a 0-10% depth, you need to keep the 5-10% bands turned on, for both the bids and the asks.

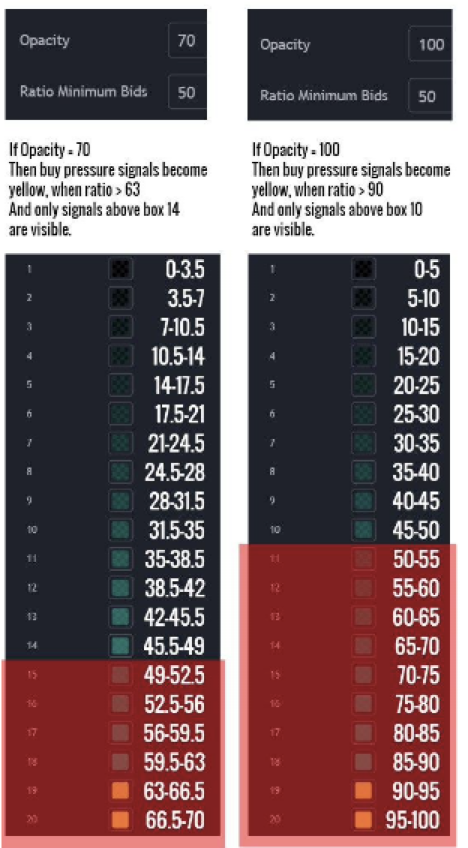
Color Your Ratios: Customize colors for specific ratios, making it easy to identify important levels. So it is 100 divided by 20 boxes = 5 per box, so if you want to highlight the ratios above 90 with yellow I change the color of box 19. Another example if you want the ratios above 70 to be yellow. You set the opacity cap at 100 there are 20 boxes so for 70 I select the 15th box.

Optimization:
Refine Your Settings: Based on back testing results, optimize your overlay setup. This may include disabling certain bands or adjusting depth ranges.
Multi-Exchange & Market types: Remember to check the overlay on multiple exchanges and different markets to gain a broader market perspective. For example the ratios on spot markets are usually higher compared to perpetual markets. Why? Because the books are thicker (more liquid) on perpetual markets.
Fine-Tune Colors: Make any final color scheme adjustments to suit your preferences.
Lower Time frames: Overlay optimization is most effective on lower time frames since it's based on candle closes.
5. Order Book Depth Overlay aggregation:
This feature displays the aggreagated overlay from all exchanges for the chosen markets. You can select which exchanges to include in the aggregation, use markets (Spot/Perpetuals/Futures) of the same type or different markets, and decide which exchanges are to be included in the aggregation, for example, Binance & Coinbase.
Conclusion:
Mastering the Overlay feature provides you with a powerful tool for visualizing the strenght of the order book. By following these steps, you can create a customized overlay setup that suits your trading strategy and preferences. Explore, backtest, and refine your settings to gain a competitive edge in the market. If you want to get inspiration or you're just looking for a quick setup, make sure to check out our templates made by the most experienced TRDR's.
Last updated

