

Bid /Ask Range
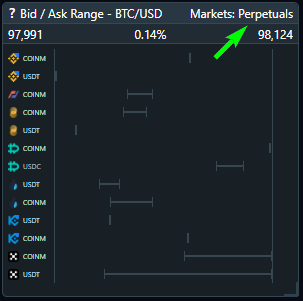
The Bid/Ask Range widget on TRDR shows the best Bid and Ask prices (buy and sell orders) on different exchanges. It can be very useful for understanding current market conditions and making more precise trading decisions. Here are some of the benefits it provides:
1. Identifying Support and Resistance
If you notice that the best Bids on major exchanges are concentrated at a certain price, it means many buyers are ready to buy at that price. This level can be seen as support—a level where the price might slow down or stop because demand is strong. Similarly, if Asks on all exchanges are close to one price, this could be a resistance level, where the price may rebound to go higher.
2. Warnings of Volatility and Risk
When you see a large gap between the best bid and ask prices, it can indicate high volatility—the market may suddenly shift in either direction, and trades may experience slippage (you might not get the exact price you were aiming for). This is a signal to be more cautious, especially when trading large volumes.
Practical Advice: Keep an eye on this widget to understand when the market is "stable" and bid/ask levels are consistent, or when sharp price swings are expected, helping you plan your trades more precisely.
3. Choosing the Best Exchange for a Trade
If you want to buy or sell cryptocurrency, the widget helps you to choose the exchange with the most favorable price. For example, if you see that the best Bid (buy price) is higher on one exchange than others, it may be a good place to sell your coins since buyers want to pay more.
4. Choosing a Market to Inspect
It is also useful to check Bid/Ask Ranges on different markets.
Click on the "Markets" link and choose: Spot, Perpetuals, or Futures. More about market types...
Insight: If you see that ranges are grouped on both Spot and Perpetuals, this may indicate even greater support or resistance strength.
Last updated