

Price Range
The Price Range widget on TRDR provides a quick snapshot of the differences in price (the “spread”) across multiple exchanges, making it an efficient tool for identifying market sentiment at a glance. Here’s a detailed guide on how to best use this widget for cryptocurrency trading:
Understanding the Price Range Widget
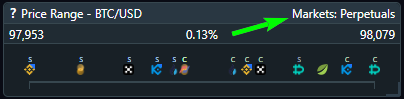
Price Range Display The widget shows a horizontal bar, where the left end represents the lowest price and the right end shows the highest price across all selected exchanges. This range updates in real-time, so you can see how prices compare across various exchanges.
Exchange Icons Each exchange is represented by an icon that moves along the bar according to the current price on that exchange. The position of each icon helps you identify pricing discrepancies across exchanges.
Market Type Selection You can switch between Spot, Perpetuals, and Futures markets within the widget. This feature allows you to compare different market types for a single asset, giving insights into how trading interest and price stability vary across these markets. More about market types...
Best Strategies for Using the Range Widget
1. Assessing Market Sentiment Across Market Types
Switch between Spot, Perpetuals, and Futures markets to gauge sentiment differences. For example:
Spot Market: Spot prices tend to reflect the “true” value of the asset since they involve direct ownership and settlement.
Perpetuals and Futures Markets: These often show premiums or discounts based on market sentiment. If the Futures price is significantly higher than Spot, it indicates bullish sentiment, as traders are paying a premium expecting future gains. Conversely, if Futures are priced below Spot, it could suggest bearish sentiment.
Use these differences to interpret how optimistic or cautious the market is regarding an asset’s short-term and long-term potential.
2. Identifying Price Stability Across Exchanges
If prices across exchanges are tightly clustered, this indicates strong consensus on the asset's value, which can signal price stability.
A wider spread, on the other hand, may indicate uncertainty or high volatility, especially if certain exchanges consistently show higher or lower prices.
3. Cross-Exchange Liquidity Insight
Observing price spreads across exchanges reveals where liquidity might be concentrated. Large exchanges with minimal price deviation may offer better liquidity, while smaller exchanges with higher volatility may carry higher slippage risks.
Favor exchanges that regularly show stable prices (near to the center of the widget) as this often translates to more reliable trade execution.
Conclusion
By integrating the Range widget into your routine, you gain a strategic overview of price variations and market sentiment, empowering you to be more informed.
Last updated