

Alerts Console
Overview
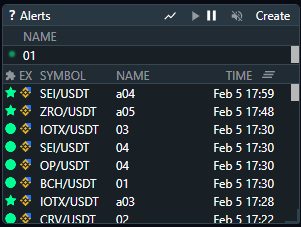
The console provides a comprehensive view of current alerts, their statuses (active, paused, triggered), and a log of when they were last triggered. To show the Console you need to turn on the “Alerts” widget in the “Layouts” section.
Console Features
Play, Pause, Mute/Unmute, Create
Play/Pause — allows to activate or deactivate alerts without deleting them. When the alert is in the “Play” state — you will receive alerts. In the “Pause” state alerts will not be sent.
Mute/Unmute — alerts can trigger in-browser sound notifications, which can be muted if needed.
Create — Initiate the creation of a new alert.
Displaying alerts on the chart
Active alerts can be visualized directly on trading charts, represented by a customizable icon. The alerts history displayed on a chart starts from the time alerts were added and activated (after the Play button pressed).
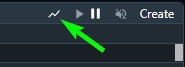
To see the alert on the chart you need to press the “Show on Chart” icon. After that you will see the “Alerts Log Overlay” indicator on the main chart. It will show all available alerts, but can be hidden manually if you need to temporarily hide it. To always preserve alerts overlay on the chart you need to save a current template.
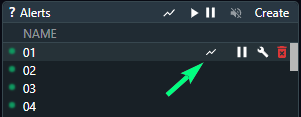
If you want only a specific alert to be shown, click Show on Chart for that specific alert.
After you have created Alerts — you need to wait for alerts appearing in the console (when alert is triggered), then press on the alert name: the corresponding pair will be opened on the main Chart and you will see an alert icon near the candle.