Open Interest / Open Interest Delta

Open Interest (OI) is a crucial indicator for traders, offering insights into the dynamics of futures and options markets. This tool enables the observation of capital flow, aiding in the identification of scenarios where there is a growing interest in establishing positions (long or short) at the current price level.
Understanding Open Interest
OI represents the total number of active derivative contracts on any given futures trading platform.
It serves as a real-time snapshot of trading activity and capital movement within the market.
Creation and Changes in Open Interest
OI increases by one contract when a buyer and seller come together to create a new contract.
If both parties close their positions, OI decreases by one contract.
Passing a contract from one participant to another doesn't affect the OI.
Functionalities

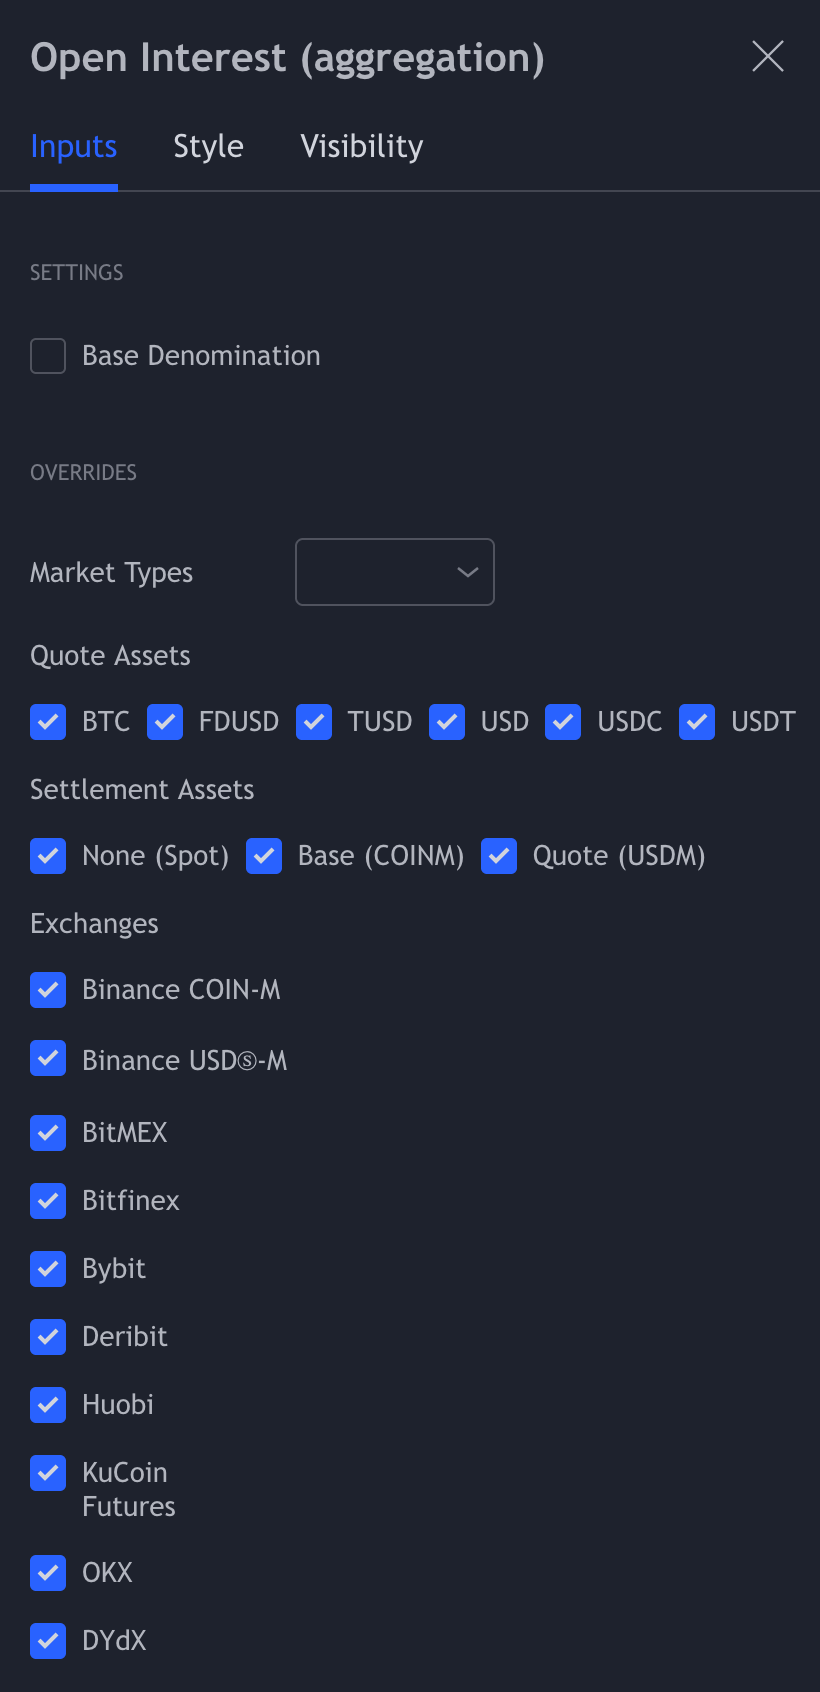
Base Denomination:
In the crypto context, OI can be measured in USD or the base denomination of the cryptocurrency.
Every market has a base currency and a quote currency. BTC/USD for example => BTC is base and USD is quote. Selecting "Base denomination" makes it so that OI is always presented in the base currency.
This is useful because some exchanges provide OI in base, others in quote currency. When using OI (aggregation), the default is always USD, but with base denomination, it will show the base currency.
It also eliminates any bias that the USD price introduces, as this can change over time.
Please keep in mind that turning this feature off will not guarantee USD denomination (like aggregated OI with base denomination off).
Market Type: Selection tool for different markets: Spot, Perpetuals, Futures.
Exchange: Choose between different exchanges.
Quote Asset: A quote asset, is one of the two assets involved in a trading pair. It is the second asset listed in the pair and is used to determine the price of the first asset, known as the base asset. Together, these two assets make up a trading pair. The quote asset is essentially the unit of measurement for pricing the base asset. When you see a trading pair like BTC/USD, where BTC is the base asset and USD is the quote asset, it means that the price of one Bitcoin is determined in terms of U.S. Dollars. In other words, if you want to buy or sell Bitcoin, you'll use U.S. Dollars as the reference currency to determine its value.
Settlement Asset: Settlement assets play a crucial role in finalizing and confirming transactions and ensuring that ownership of the traded assets is transferred between parties. At TRDR we have three categories Spot, Coin margined, USD margined.
Understanding OI in Trend Analysis
Price Up, OI Up:
Indicates a strong trend as traders are actively opening new positions to capture the price move.
Price Up, OI Down:
Suggests a weakening trend with potential for no follow-through, as traders may be taking profits or closing positions.
Price Down, OI Up: Signifies a strong downtrend, with new short positions opening during the price drop.
Price Down, OI Down:
Suggests a weak downtrend, and a potential reversal may be on the horizon.
Functionalities in Crypto Markets:
In the crypto context, OI can be measured in USD or the base denomination of the cryptocurrency.
Monitoring OI in crypto markets provides valuable insights into the strength and sustainability of ongoing trends.
In summary, Open Interest is a powerful tool that traders use to gauge market dynamics and investor sentiment. By understanding the functionalities of OI, traders can better interpret the ebb and flow of capital within futures and options markets, aiding in informed decision-making.
Aggregated Open Interest
Functionalities

Base Denomination
In the crypto context, OI can be measured in USD or the base denomination of the cryptocurrency.
Every market has a base currency and a quote currency. BTC/USD for example => BTC is base and USD is quote. Selecting "Base denomination" makes it so that OI is always presented in the base currency. This is useful because some exchanges provide OI in base, others in quote currency. When using OI (aggregation), the default is always USD, but with base denomination, it will show the base currency.
It also eliminates any bias that the USD price introduces, as this can change over time.
Combines OI from multiple selected perpetuals and futures exchanges, giving a broader market view.
Aggregation is useful to consider overall market participation, especially when some exchanges have more active traders.
Key Features of Open Interest Delta
Functionalities
Divergence Threshold
Volume divergences occur when trading behavior does not match price action. For example when there is more sell volume than buy volume, but price is closing at a higher close. You can set a threshold in order to manage when divergences are shown. A threshold of 10% ensures they are only shown when the difference in volume is at least 10% of the candles volume.
Accumulation Length
Open Interest Delta incorporates an accumulation length, allowing customization to observe changes over a specific series of candles.
An accumulation length of zero includes all data for a particular candle (10.000 candles), reflecting changes in contracts over a defined period (e.g., 5 minutes).
1 represents 1 candle so 20 is 20 candles added up together.
Customization for Time frames
Scalpers may opt for low accumulation settings (e.g., 12 candles) on shorter time frames like 5 minutes, providing a 1-hour look-back period.
Swing traders may prefer longer accumulation settings (e.g., 30 days) on daily time frames for a more comprehensive overview.
There is no "better" timeframe — all timeframes are useful. It depends on your trading style which one suits you best.
Open Interest Delta is a valuable tool for traders seeking a nuanced understanding of contract activity. By customizing accumulation lengths and interpreting visual cues, traders can gain insights into trend strength, potential reversals, and overall market conditions, aligning their strategies with their preferred timeframes and trading styles.
Last updated

