Order Book Top Levels
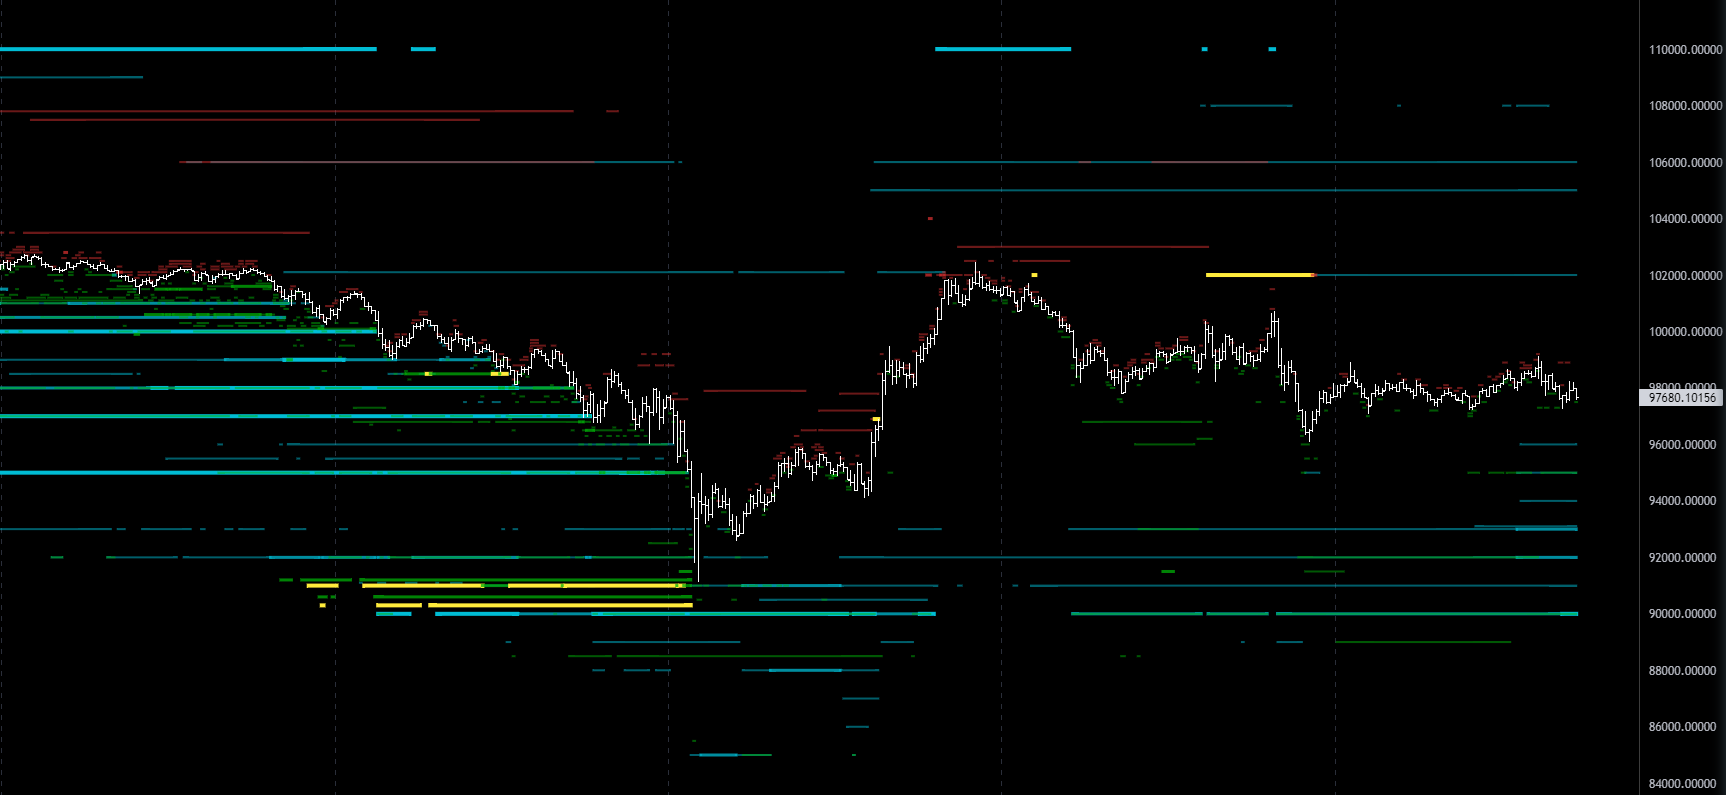
The Top Levels Indicator is a powerful Order Book inspection tool on TRDR that helps traders identify key liquidity zones where major market participants, such as institutions and market makers, are actively placing large orders. By revealing these critical levels, the indicator provides valuable insight into potential areas of support and resistance, allowing traders to make more informed decisions.
Market Liquidity X-Ray
Think of the Top Levels Indicator as an X-ray into the order book. It presents a real-time heatmap of the largest active orders (up to the top 10 buy and sell orders) within the visible range of the selected exchange's order book. This allows traders to:
Risk Management & Trading Strategy
Traders use the Top Levels Indicator as a risk management tool, helping them: 🔹 Identify critical price levels where large orders may stall momentum. 🔹 Set stop-loss and take-profit levels based on order book structure. 🔹 Avoid entering trades near liquidity walls, reducing slippage risks.
For example, if an asset’s price has been steadily rising but stalls at a specific level, it could indicate a large sell wall (displayed as a blue line). This suggests that major traders are either taking profits or shorting the asset, leading to a possible price rejection. In such cases:
The price may reverse downward due to strong selling pressure.
It could consolidate before attempting another breakout.
Traders who sold at the resistance level may re-enter at lower prices, reinforcing the cycle.
Key Inputs:

Price Range: Select a price range for the bids & asks, the bids will show below price the asks will show 25% above price.
Size in USD: Specify a USD value, ideal if you want to filter based on USD size per limit order.
Level Range: Select the biggest limit orders in the specified range. Example if you select top 5, the indicator will show the biggest 5 bids and asks.
Visible Range Only: When enabled, this option calculates relative sizing and visual styling (such as line thickness and colors) based solely on order book levels within the currently visible chart range. This ensures that visual contrast remains optimal for the data currently in view, rather than being distorted by off-screen historical extremes. Enabling this option is highly recommended.
Continuation: Length: Displays order book levels only after they have remained continuously present for the specified number of periods. This acts as a filter to show only persistent levels, reducing noise by hiding those that appear only briefly. When the length is greater than 0, new levels must hold their position for the full duration (multiplied by the specified timeframe) before becoming visible. Example: you want to see only Top Levels longer than two hours. You set the length to 2 and select the 1h timeframe. Timeframe: The effective duration of the Top Level depends on the selected timeframe. You can either use the same timeframe as the current chart or set a custom one. Example: You want to see only Top Levels that are 4 times longer than any current chart timeframe. To do this, set the length to 4 and select "Use Chart" as the timeframe.
High Contrast: When "High Contrast" is enabled, the smallest level will always be displayed using the smallest line, as opposed to being compared in absolute terms to the largest level (which could mean that the smallest level is similar to the largest level and would be displayed using the largest line, leaving little contrast)
Force market type: All indicators have their market type and / or exchange overridden. For example, you could use the overlay indicator and set market type to "Perpetuals" and exchange to "Binance Futures" and it would stick to that, regardless of which pair you select. But if you just select perpetuals it will only show on a perpetual market. More about market types... The ratios on spot markets are usually higher compared to perpetual markets. Why? Because the books are thicker (more liquid) on perpetual markets.
Style:
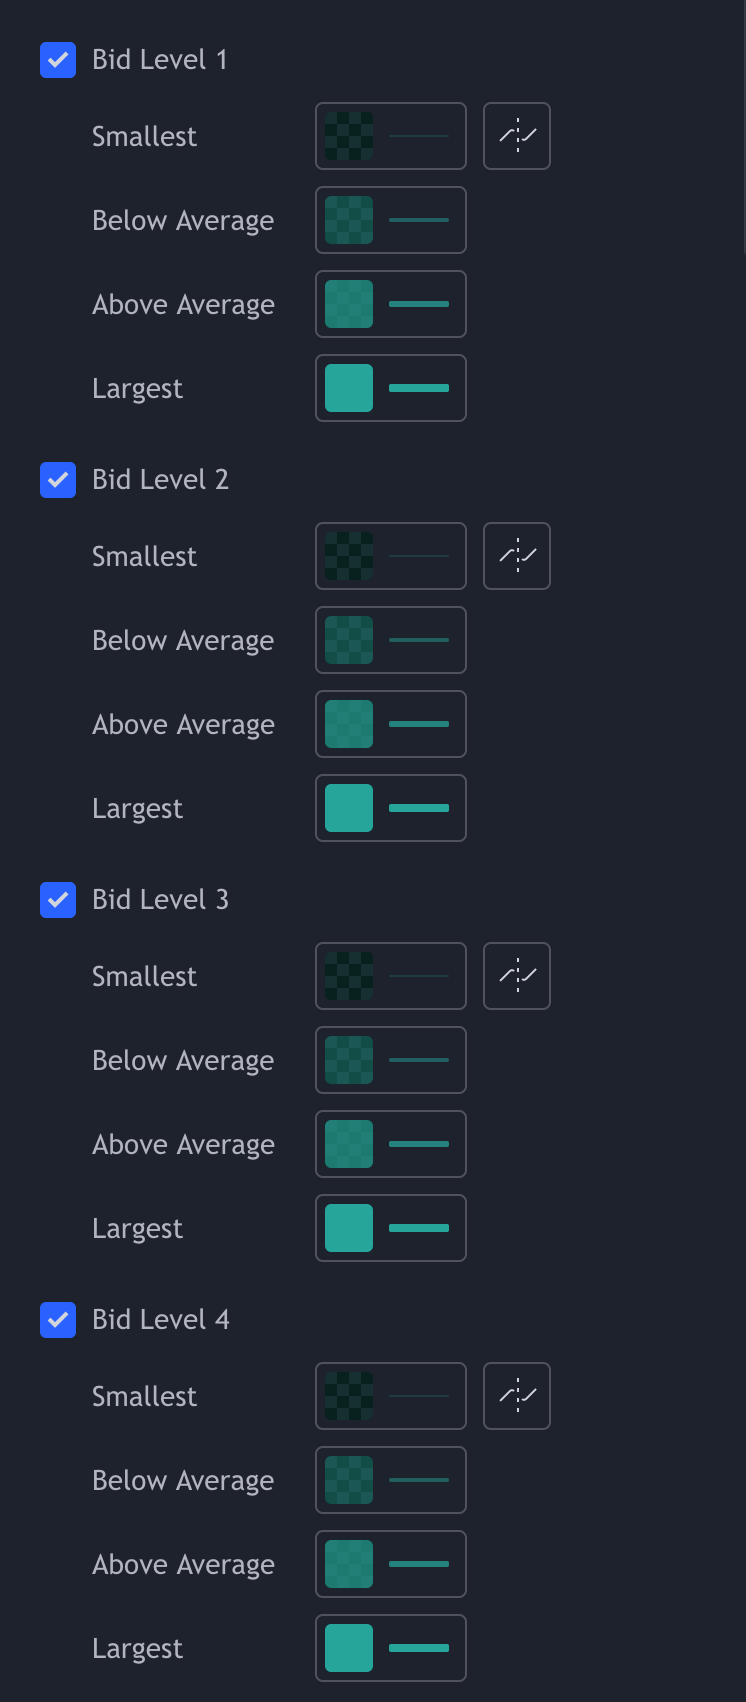
Smallest
Adjust the color and line thickness for the smallest order visual on the chart.
Below average
Adjust the color and line thickness for orders below average.
Above Average
Adjust the color and line thickness for orders above average.
Largest
Adjust the color and line thickness for the largest order.
Adjustments made will change them for all the bid levels. Example video ⬇️
How to use Top Levels
To maximize the utility of the Top Levels, it's best to align the indicator with the Order Book Overlay. Top Levels can be used in the following ways:
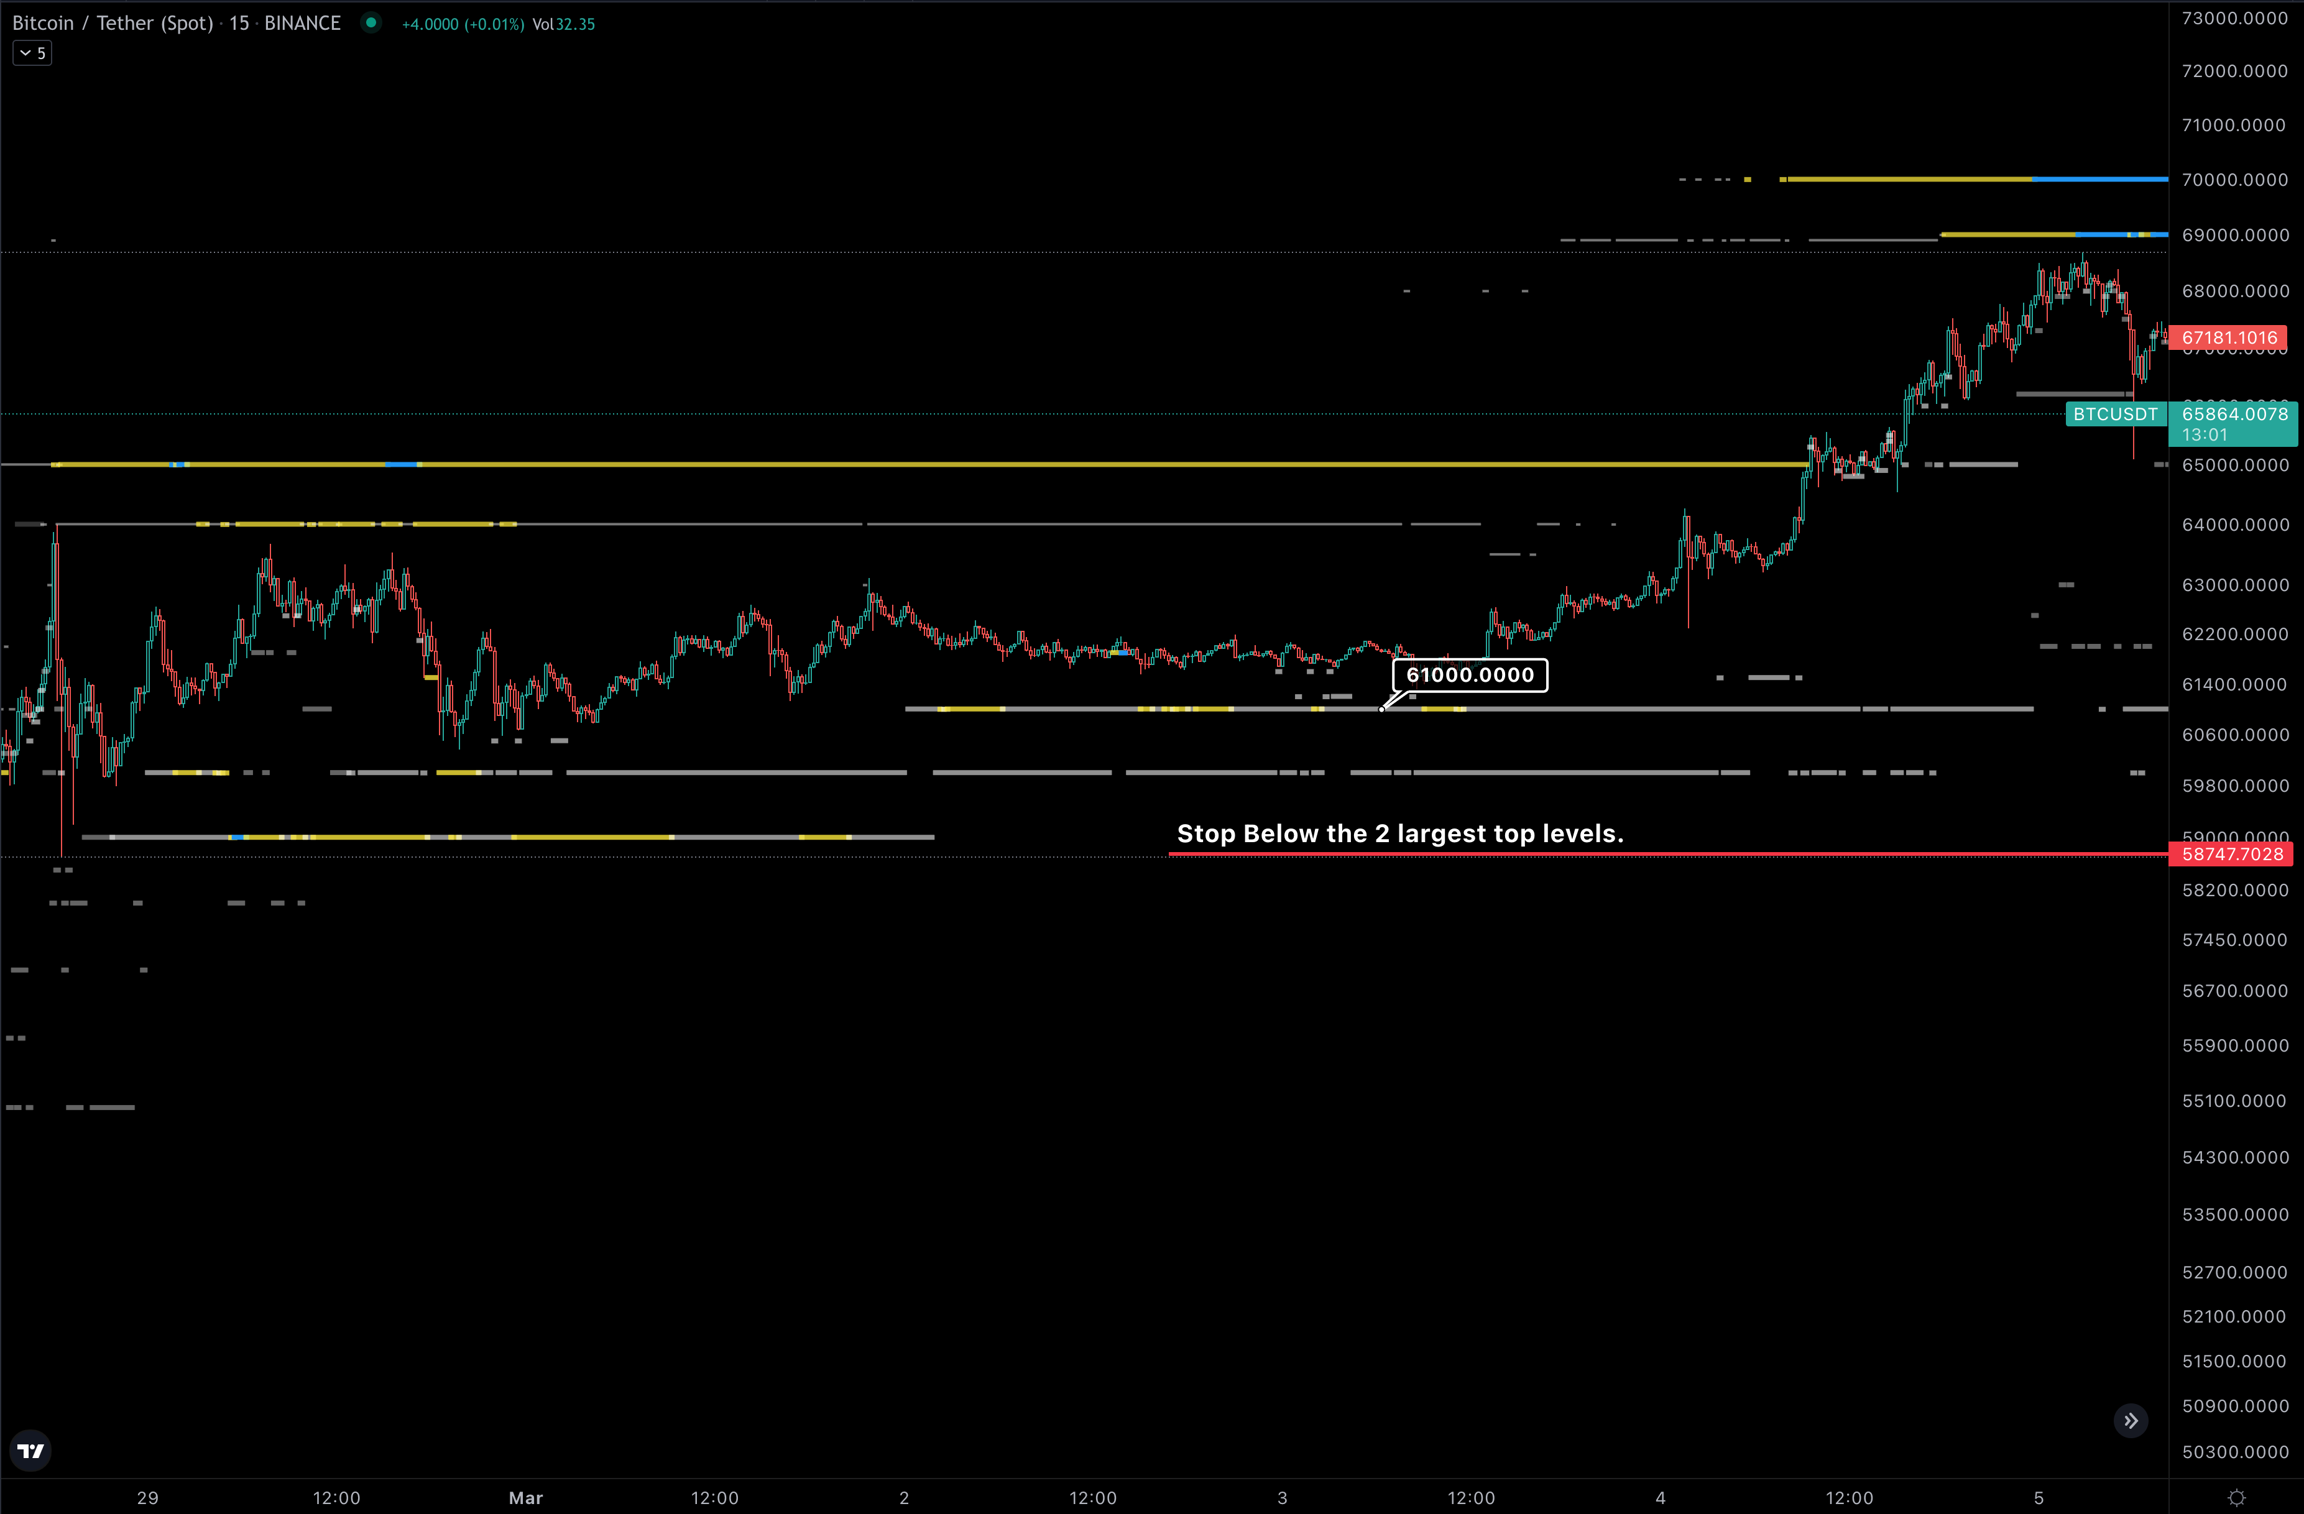
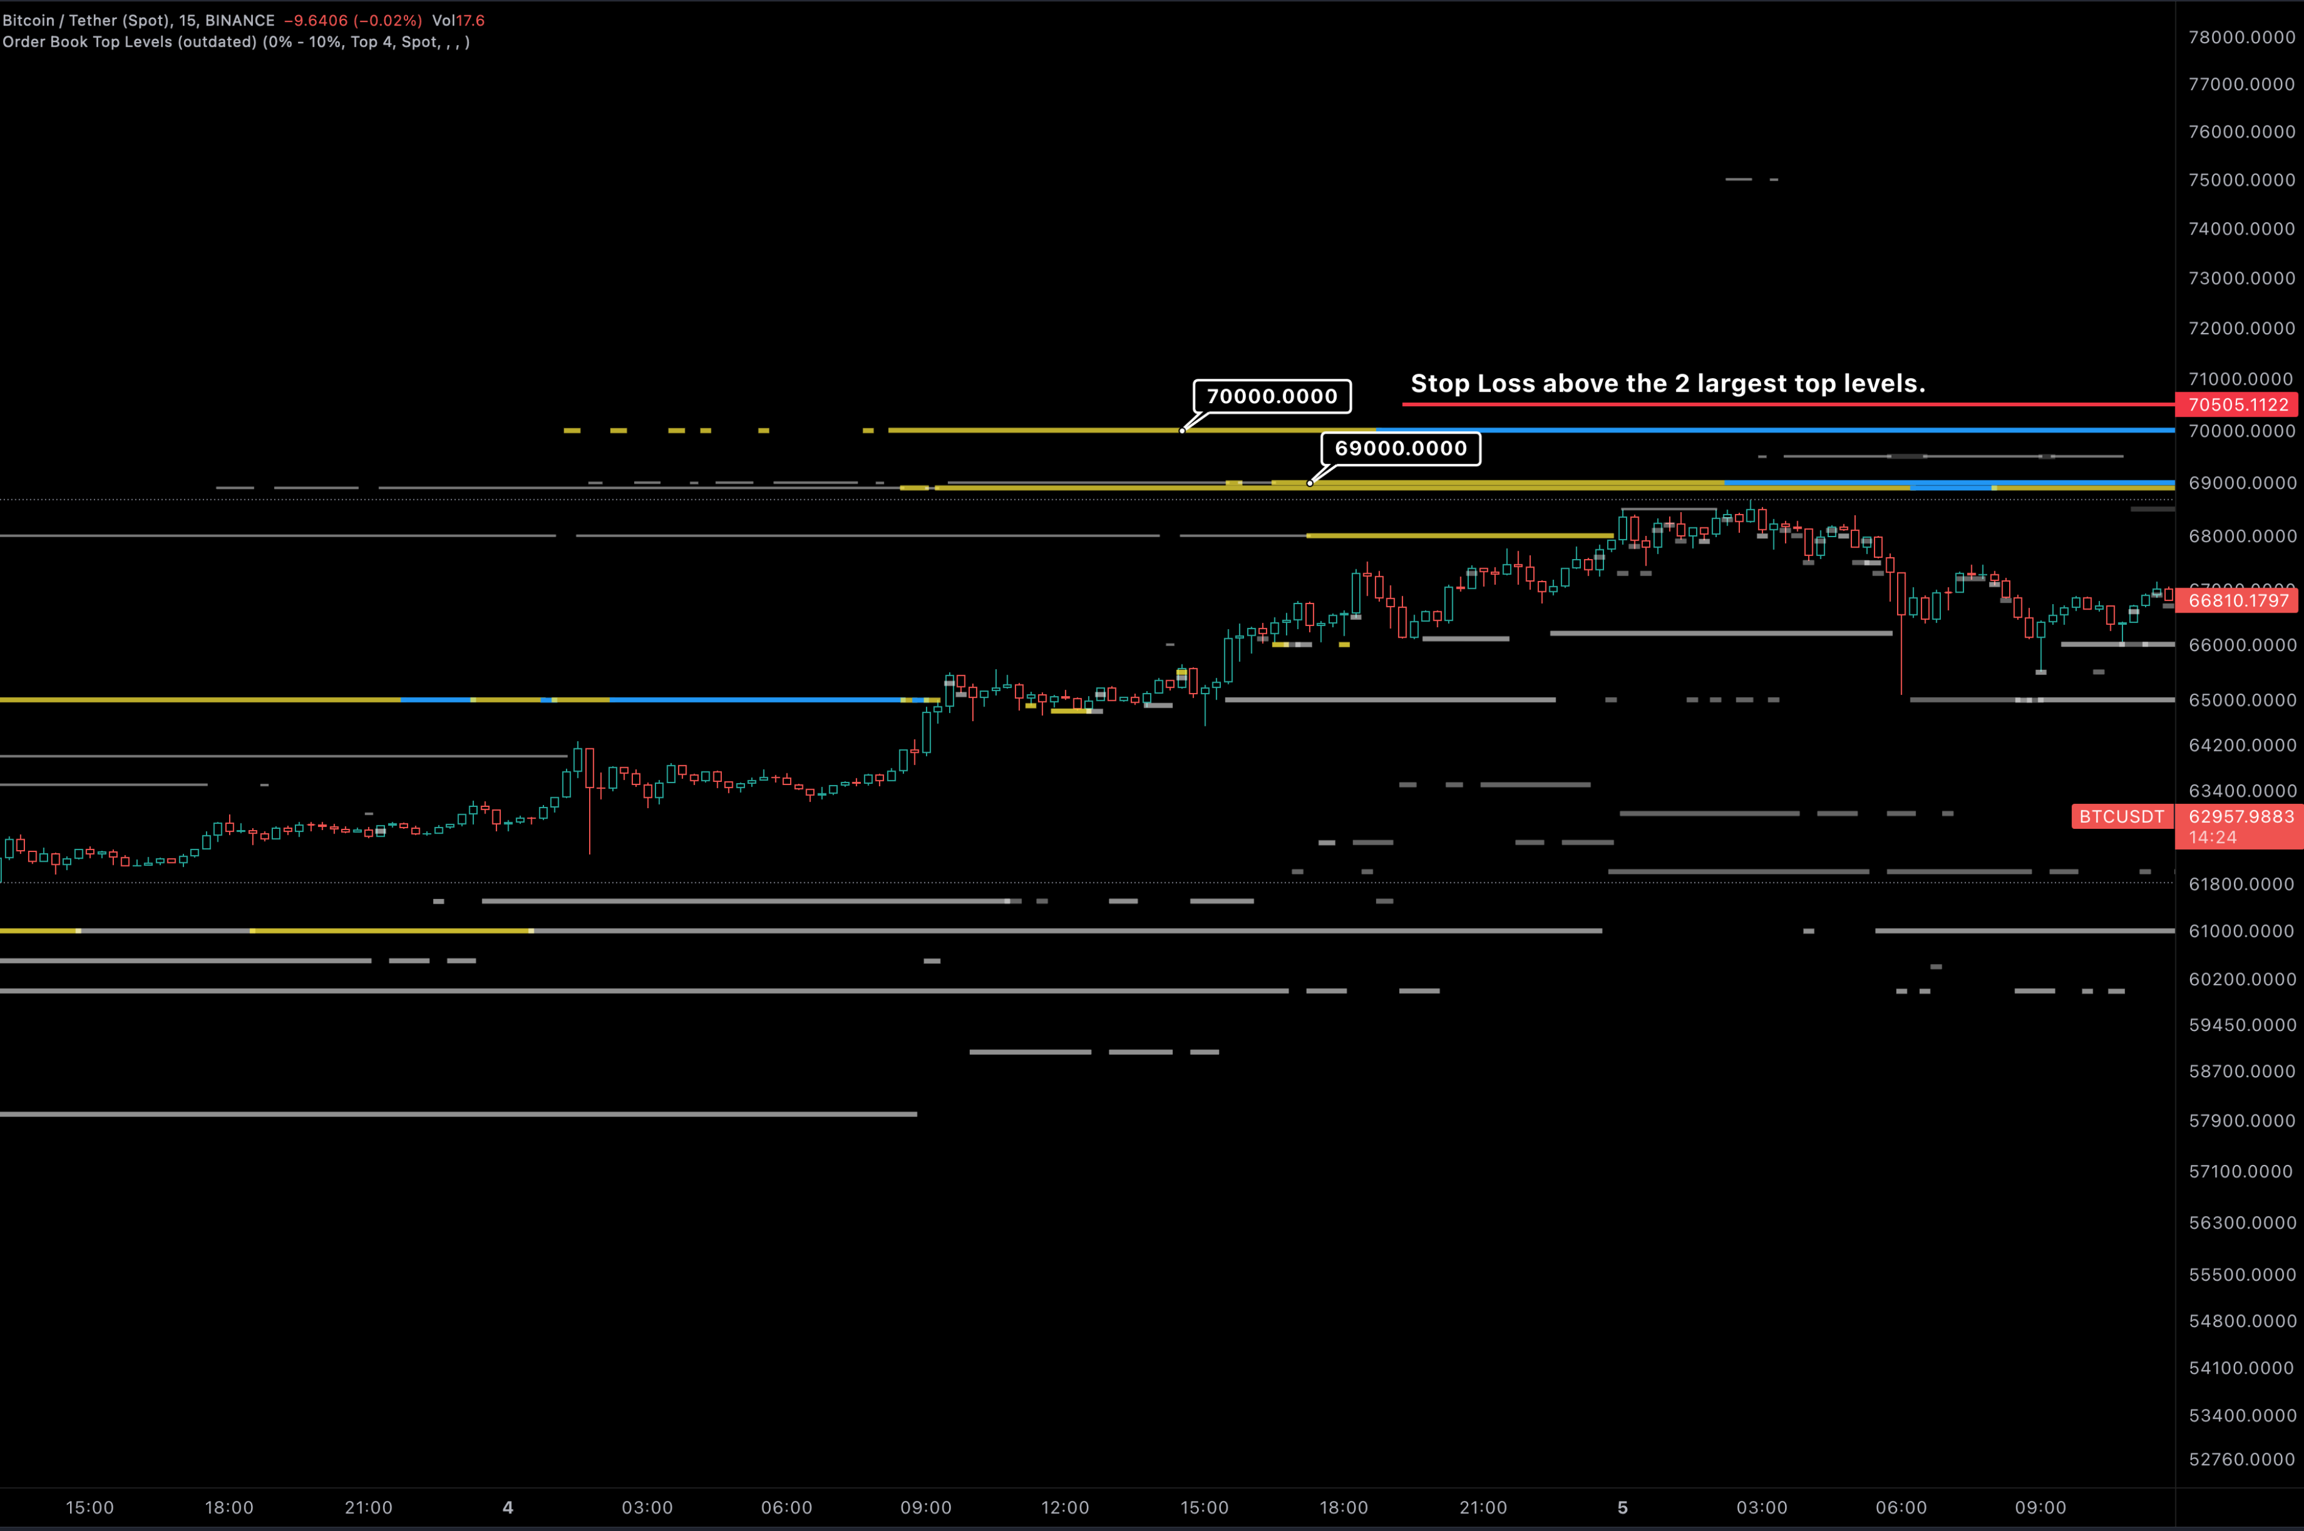
Initiate a long position at the demand (as indicated by Order Book Overlay) and use the top levels as entry point and or risk areas. Putting stop losses below a bid top levels or above an ask top level. Long example:
Short example:
Templates
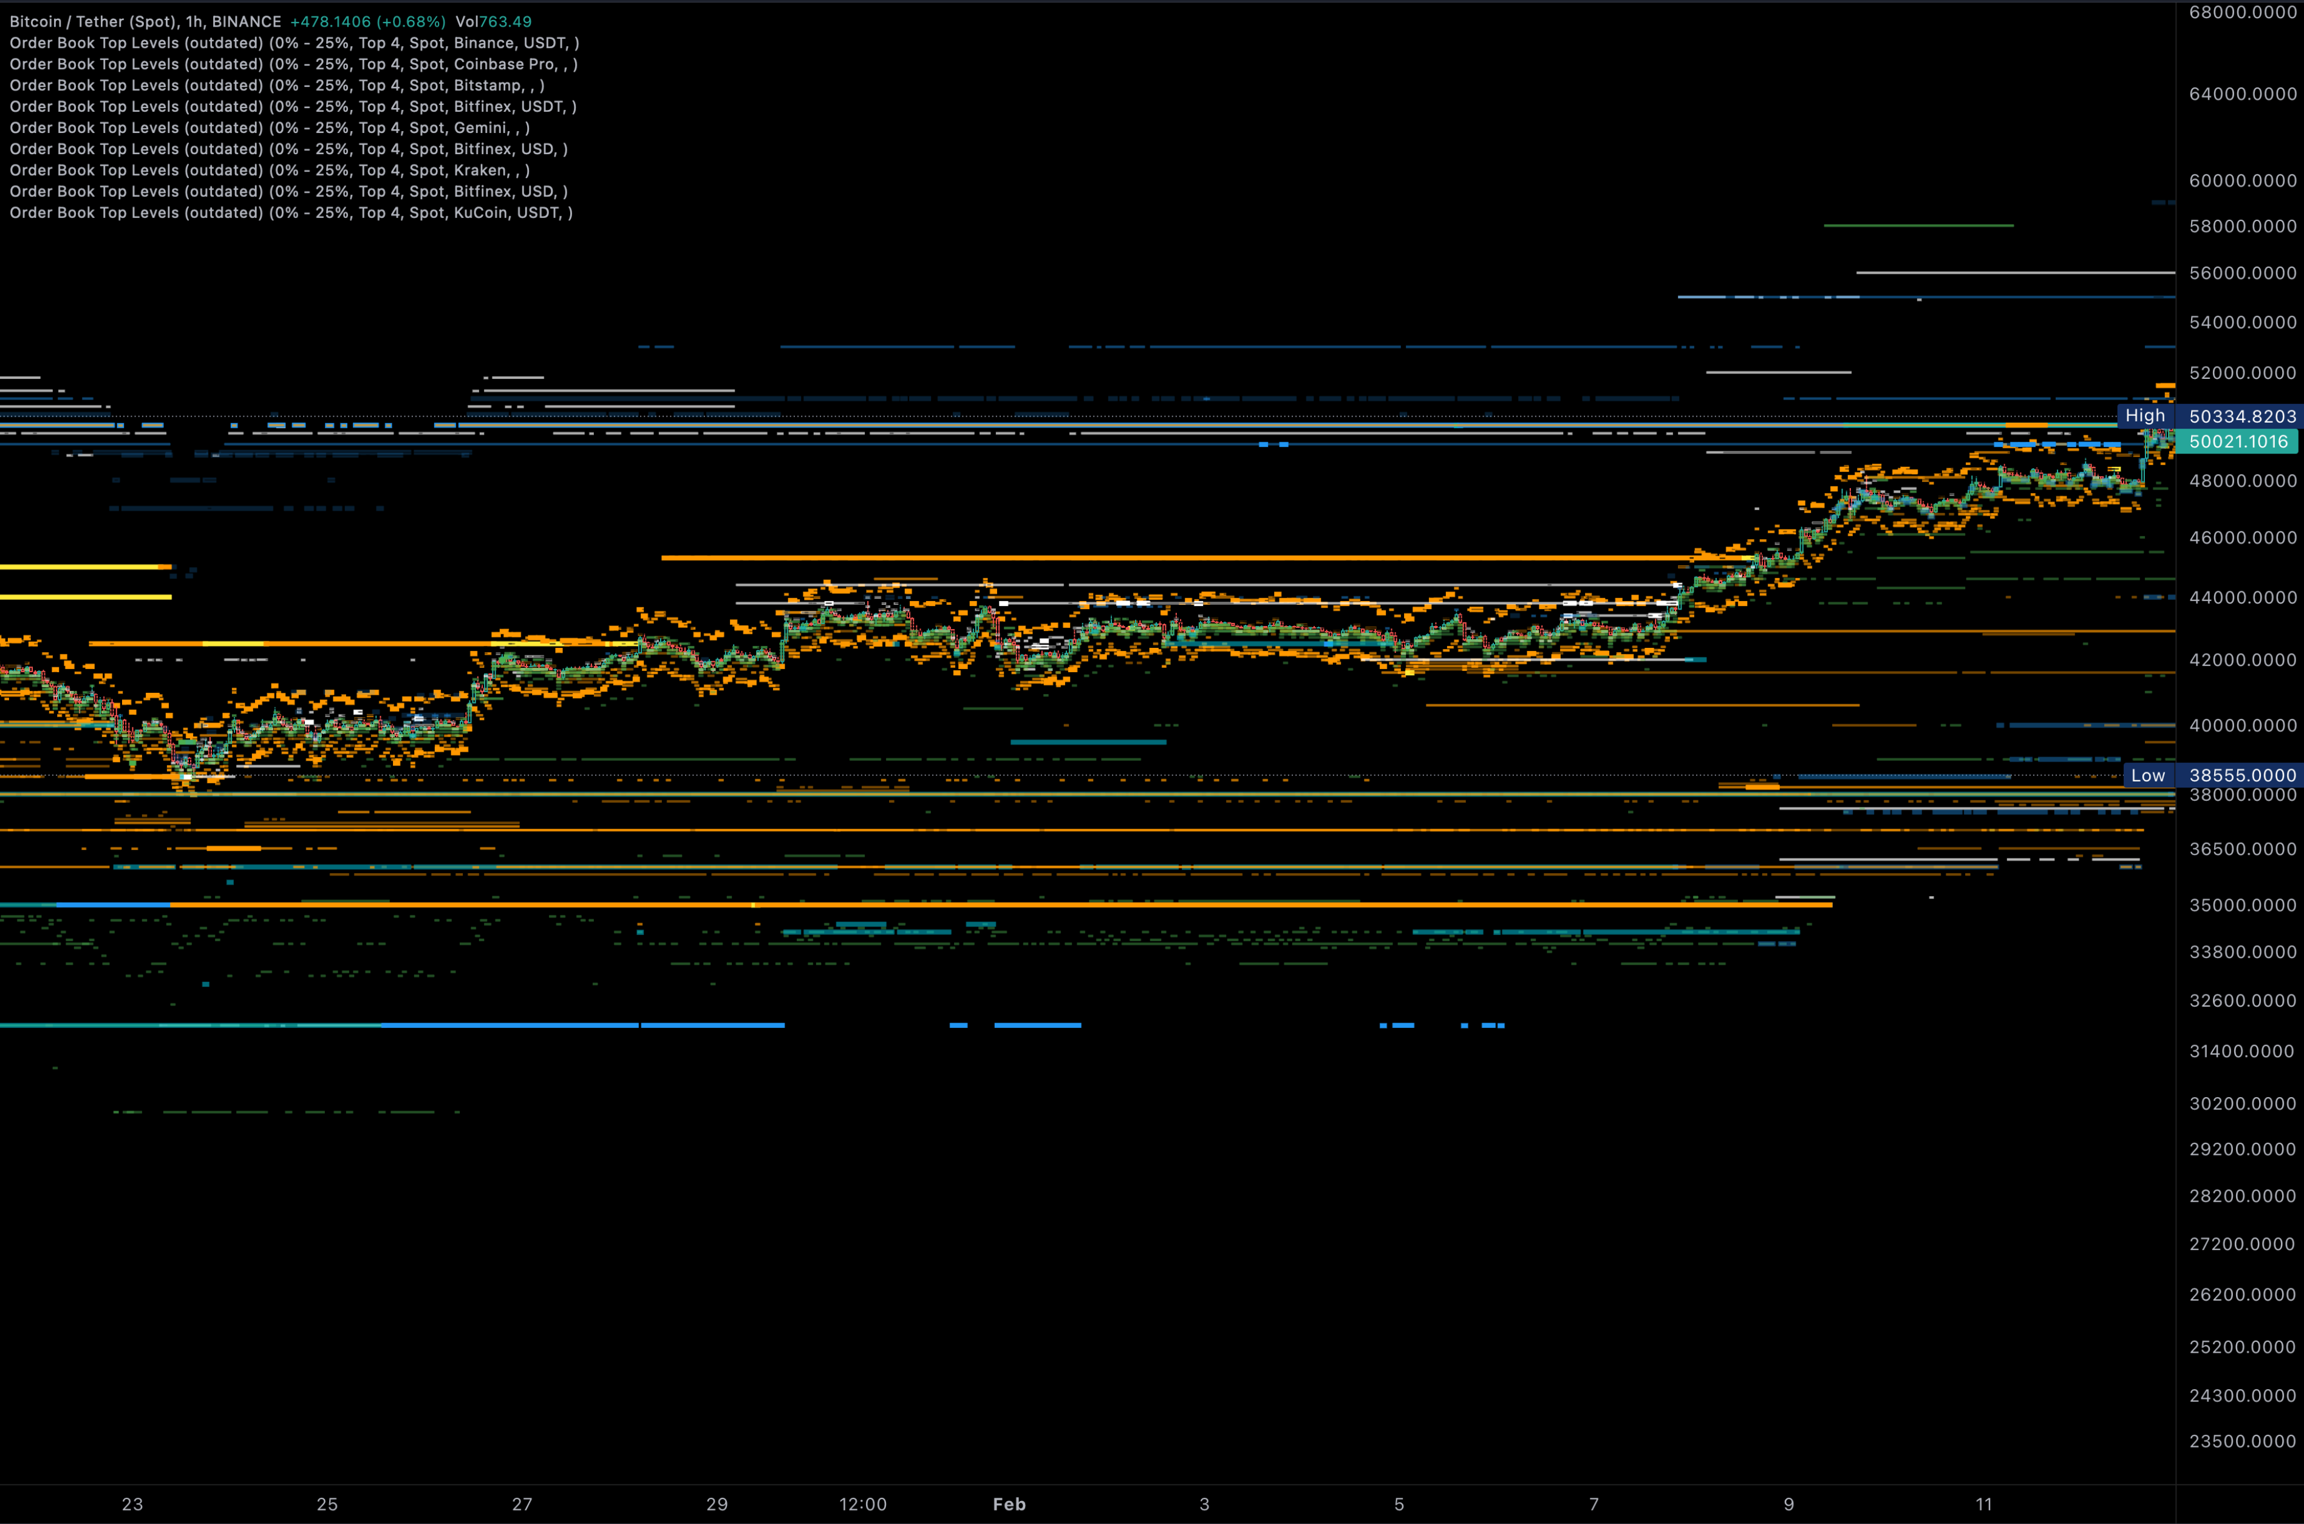
Pro or higher subscription Required https://www.trdr.io/u/DK/t/Aggr%20Top%20Levels%20Spot
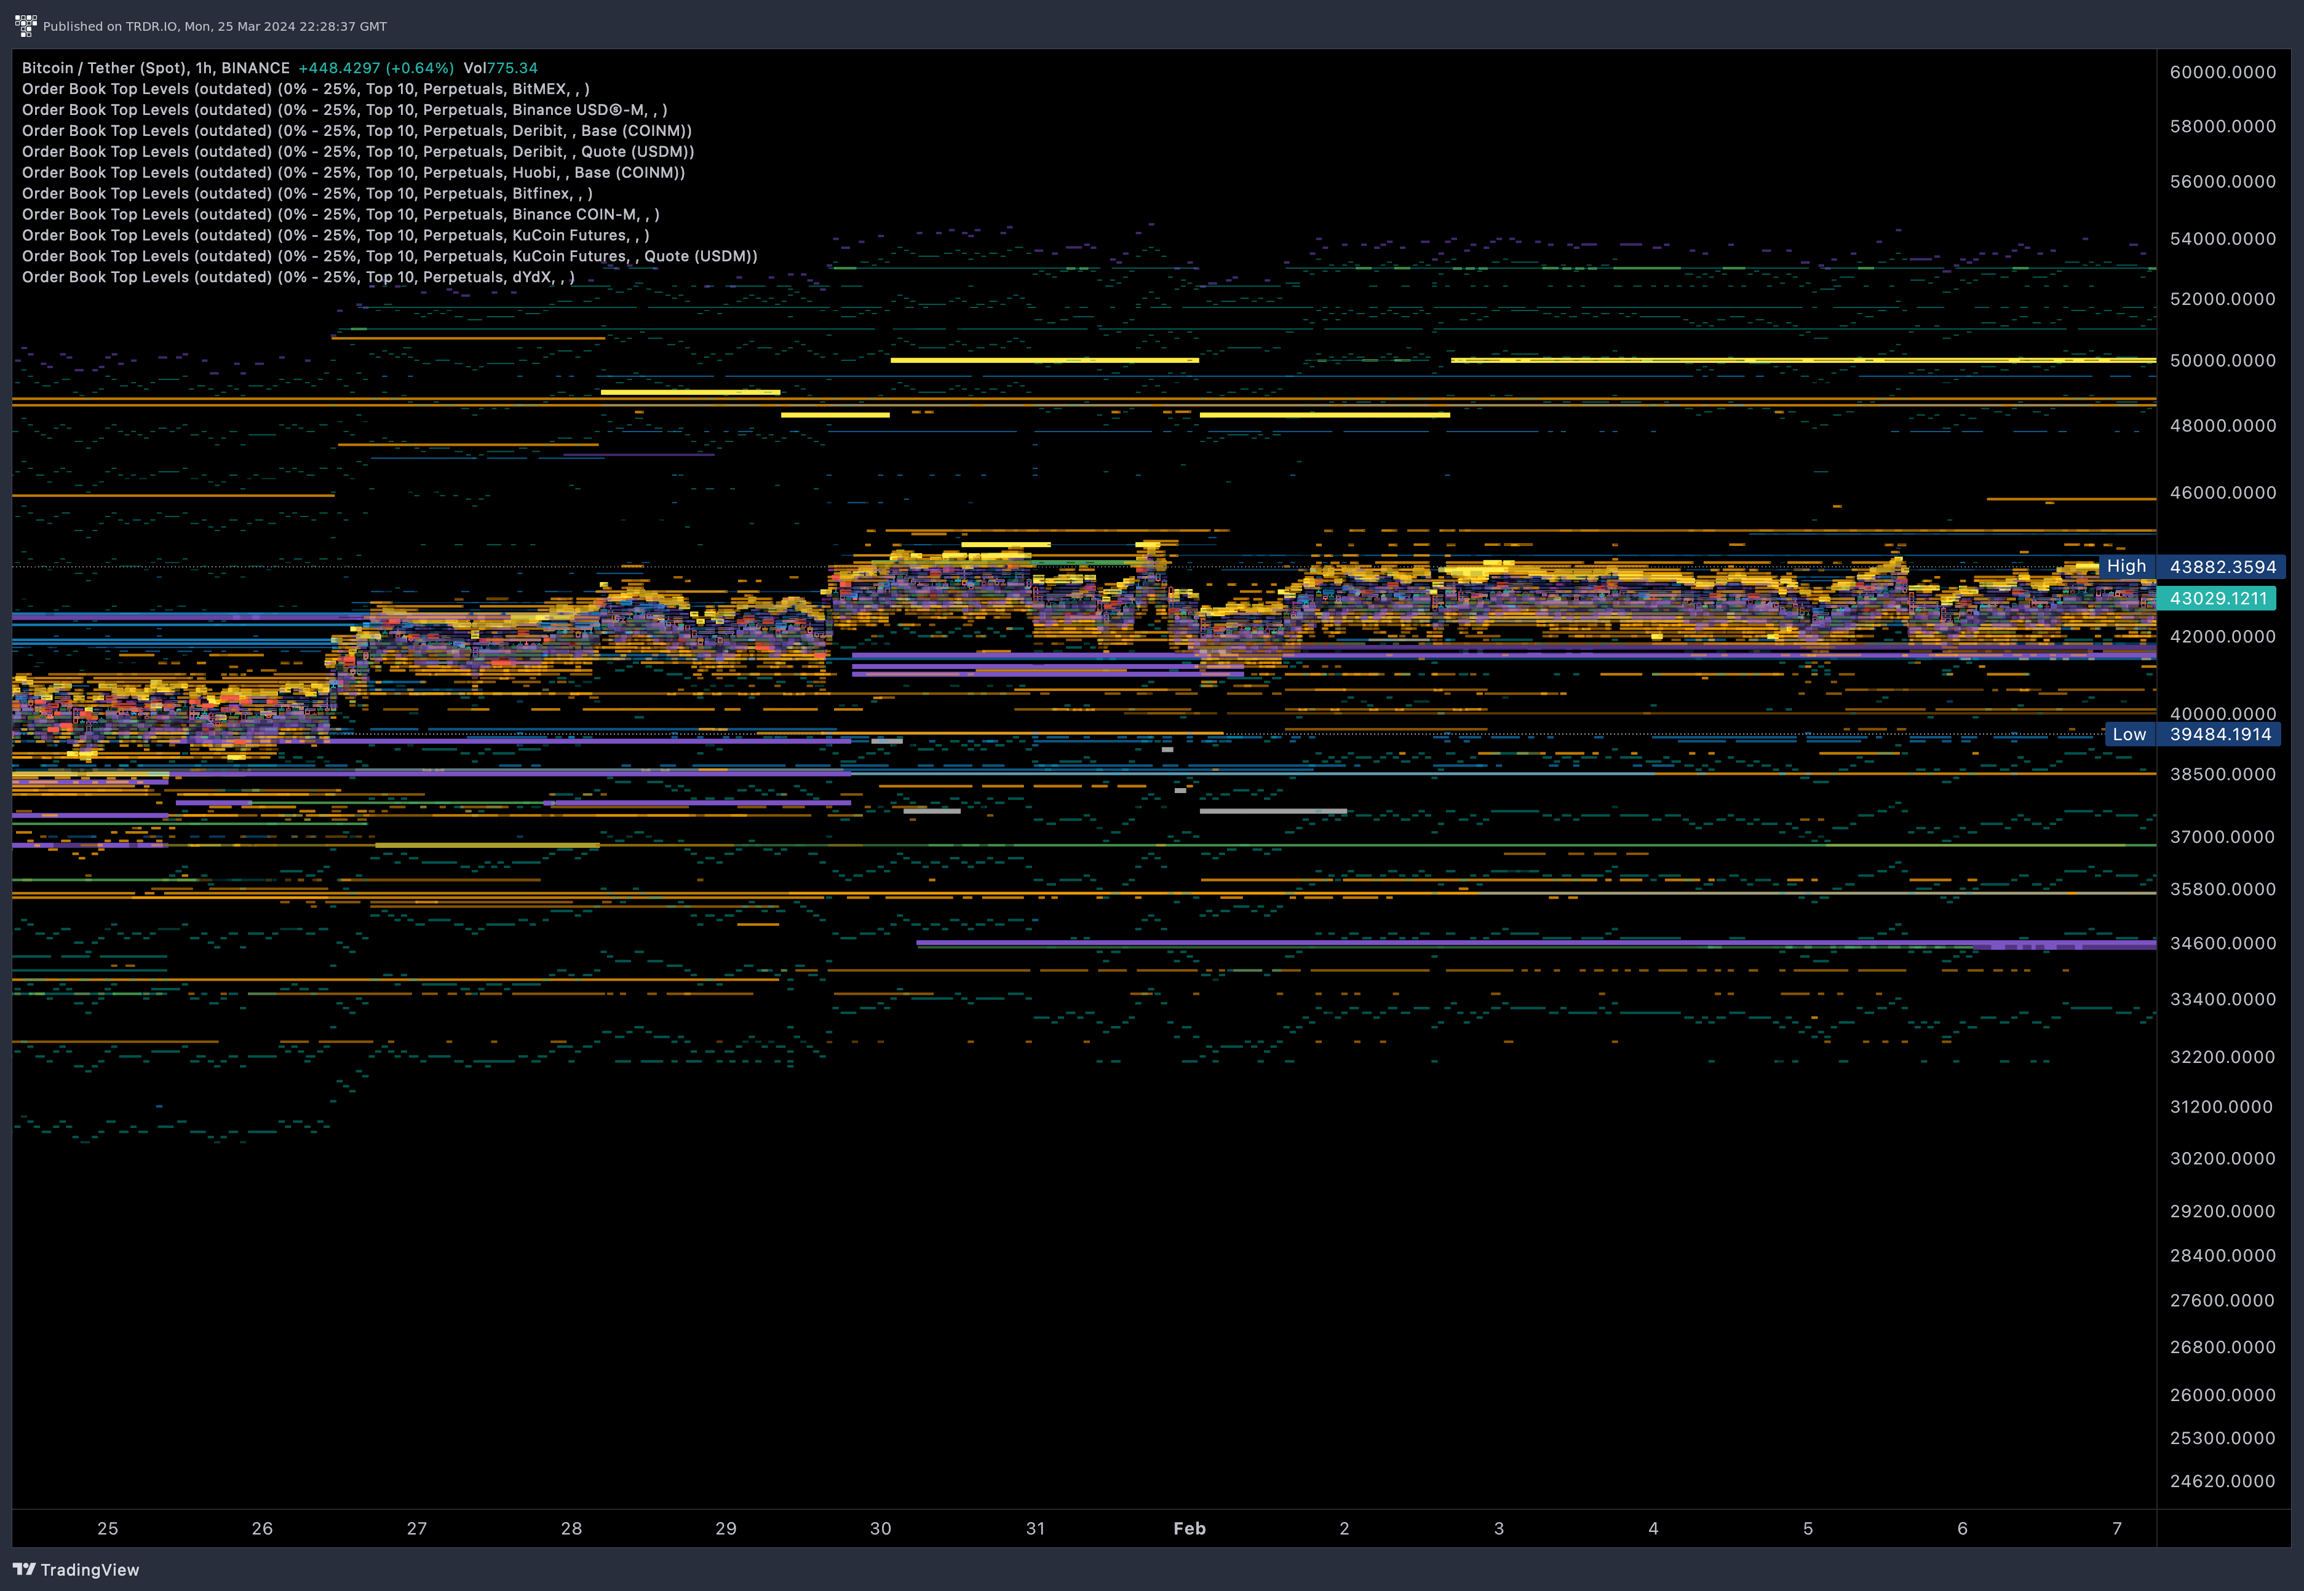
https://www.trdr.io/u/DK/t/Aggr%20Top%20Levels%20Perp
Last updated

