Order Book
Overview of the Order Book Widget
The Order Book (OB) widget displays detailed real-time data on Limit Buy and Sell Orders at various price levels. The widget provides features like:

By clicking a price level in the order book it is cross-referenced in the Order Book Changes (OBC) widget, helping traders track dynamic changes.
Significance of Spot and Perpetual Markets
Spot Market Spot markets represent real-time, direct purchases or sales of an asset, reflecting immediate market sentiment and liquidity. Analyzing the spot market order book can provide insights into organic buying and selling interest, making it valuable for detecting strong price levels that hold high bid/ask volumes.
Perpetual Market Perpetual markets (or perpetual futures) allow traders to trade the asset with leverage, which often increases volatility and trading volume. Perpetual markets reflect more speculative, leveraged interest, and their order books can reveal market sentiment for both short-term movements and potential price trend continuation or reversal.

Key Order Book Range Significance
Each range in the order book represents different types of market interest and trader psychology:
0% - 1% Shows orders very close to the current price. This range is crucial for understanding immediate liquidity and where aggressive orders tend to cluster. Heavy interest here can suggest short-term support or resistance.
1% - 2.5% Often reflects active, near-term trading interest. Changes in this range are also essential for intraday moves, as they can signal shifts in immediate sentiment.
2.5% - 5% Range is important for both intraday and swing traders; it shows medium-term support and resistance levels. If these levels are frequently filled or adjusted, it can indicate the market's longer-term bias.
5% - 10% Represents less immediate, larger bid/ask walls that act as secondary support or resistance levels. Changes in this range are more common in swing trading strategies, helping to spot potential market reversals or support.
10% - 25% This range includes deep liquidity levels and reveals the extent of market participants’ willingness to protect positions. It's often used to gauge longer-term sentiment or identify extreme support and resistance zones that are less likely to be tested intraday.

Range Priorities:
Intraday Traders and Scalpers should focus on 0% - 5% ranges, as they reveal immediate sentiment and short-term momentum.
Swing Traders benefit from analyzing 1% - 10% ranges, as these levels provide insight into potential support or resistance that aligns with larger trends.
Step-by-Step Order Book Configuration
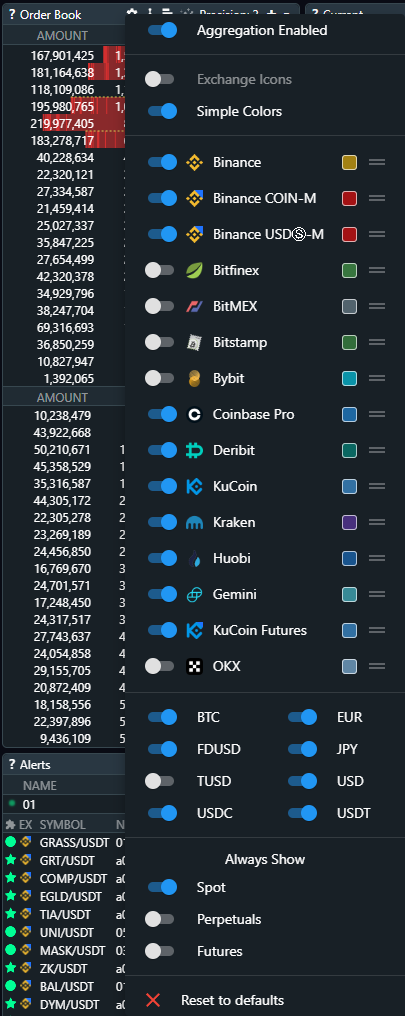
Enable Aggregation switch
Aggregation represents order book volumes by grouping data from different exchanges. Enable this if you’re focusing on support/resistance across multiple exchanges. If you will disable it - OB will show only the data from selected assets in the Order Book Depth widget.
When Aggeration is enabled — the amounts are shown in USD.
When Aggeration is disabled— the amounts are shown in COIN.

Select Market Types
Spot: Set to analyze organic, real-time demand.
Perpetuals: Set to gauge speculative interest.
Futures: Include this to capture classic Futures interest.
Strategy for Using the Order Book in Spot and Perpetual Markets
1. Analyze the Short Term Market
Start by observing the 0% - 5% range on both Spot and Perpetual markets to gauge short-term liquidity, demand and significant bid/ask walls. Consistent buy or sell walls indicate where traders expect price movement.
2. Identify Key Levels
Search the concentration of orders with the biggest volumes to locate strong bid and ask levels across Spot and Perpetuals. Large bids can indicate support, while significant asks highlight resistance.
3. Cross-Market Comparison
A higher bid wall on Spot with weak bids on Perpetuals might mean genuine buying interest rather than leveraged speculation. Conversely, a higher ask wall in Perpetuals could mean resistance is driven by short-sellers.
Spot activity reflects organic interest, whereas Perpetual markets are more reactive to leveraged positions. A convergence of support levels in both markets suggests stronger confidence, whereas divergence may signal uncertainty.
4. Cross-Reference Depth with Order Book Changes
Use the OB alongside the Order Book Changes widget to see how specific levels evolve. If there’s a pattern of bid/ask reduction at certain levels, it may indicate weakening support or resistance.
Trend Analysis with OB
Spotting Market Sentiment through Bid/Ask Volumes
Increasing Bid Volumes (Demand) If bid volumes are increasing at higher price levels (closer to the current price), it often indicates strong buying interest. This type of activity, known as "bidding up," suggests buyers are willing to purchase at higher prices, which can signal a bullish trend.
Increasing Ask Volumes (Supply) Conversely, if ask volumes increase closer to the current price, it signals higher selling pressure. This "offering down" behavior shows that sellers are willing to lower prices to execute orders, which can point to a bearish trend.
Identifying Shifts in Demand/Supply Zones
By monitoring where significant volumes of bids and asks are placed relative to the price, you can identify support (bid-heavy) and resistance (ask-heavy) zones. If these zones move closer to the current price, it often indicates growing market interest in that price range, which could lead to a trend reversal or continuation.
Example: If you observe a large increase in bid volume in the 1%–2.5%–5% range below the current price, this suggests potential support, which could limit downside and indicate an upward trend continuation.
Order Book Imbalance as a Trend Signal
Imbalance between bids and asks is a key signal in OB analysis. Note if the bids consistently outweigh asks or vice versa. When the cumulative volume of bids significantly exceeds asks at various price levels, it may imply bullish market sentiment. Similarly, when asks outpace bids, it might signal bearish sentiment.
Liquidity Analysis with Order Book
Tracking Liquidity Clusters
Liquidity clusters are areas where large buy or sell orders are concentrated. These clusters represent zones where traders feel comfortable buying or selling. Tracking the position and volume of these clusters helps gauge overall liquidity, and changes in these clusters can signal shifts in market sentiment.
Example: If a large bid cluster (support) begins to thin out or is removed altogether, it indicates reduced buying interest, potentially weakening support and increasing the likelihood of a price drop.
Watching Depth Across Ranges
By analyzing liquidity depth across different ranges (e.g., 0%-1%, 2.5%-5%, etc.), you can see where the majority of buy/sell orders are positioned. This depth distribution indicates how “thick” or “thin” the market is at various levels. In liquid markets, you’ll often see large order volumes within 0%-2.5% of the price, making these levels highly reactive.
Liquidity Shifts Over Time Large volume orders moving further away from the current price can signal a decrease in liquidity, suggesting that traders are pulling back, possibly in anticipation of volatility.
Spotting Fake Liquidity (Spoofing)
In the OB, spoofing occurs when large orders appear temporarily to simulate demand or supply, then disappear as the price approaches. Observing and filtering out these “fake” orders can prevent false interpretations of market trends. If you notice large bid or ask volumes that frequently appear and disappear, this may indicate spoofing rather than real liquidity shifts.
Conclusion
By setting up and interpreting the OB widget thoughtfully, you can gain a deep understanding of support and resistance levels, identify trends early, and make well-timed trading decisions based on real-time order flow. 🚀
Last updated


