Order Book Depth Totals (Liquidity)
The Order Book Depth on TRDR is a powerful tool for assessing market liquidity, providing traders with a clear view of the total value of bids and asks in the order book. By analyzing totals, bid/ask delta, and liquidity ratios, this indicator helps traders identify market strength, potential reversals, and order flow imbalances with precision.
Total Market Liquidity Calculation
The indicator aggregates the total value of buy (bids) and sell (asks) orders within the selected depth range, giving traders an instant overview of liquidity concentration.
Formula:
Total Liquidity = Bids + Asks
For example: 🔹 Bids: Ƀ959 🔹 Asks: Ƀ285 🔹 Total Liquidity: Ƀ1244
This metric is essential for understanding liquidity conditions on an exchange and identifying key accumulation and distribution zones.
Liquidity & Market Stability
High liquidity generally signals a stable market with smoother price action, while low liquidity can lead to higher volatility and potential price manipulation. Traders can use this indicator to:
By understanding how liquidity builds up and dissipates, traders can make better-informed entry and exit decisions, reducing the risk of unfavorable execution.
Key Inputs
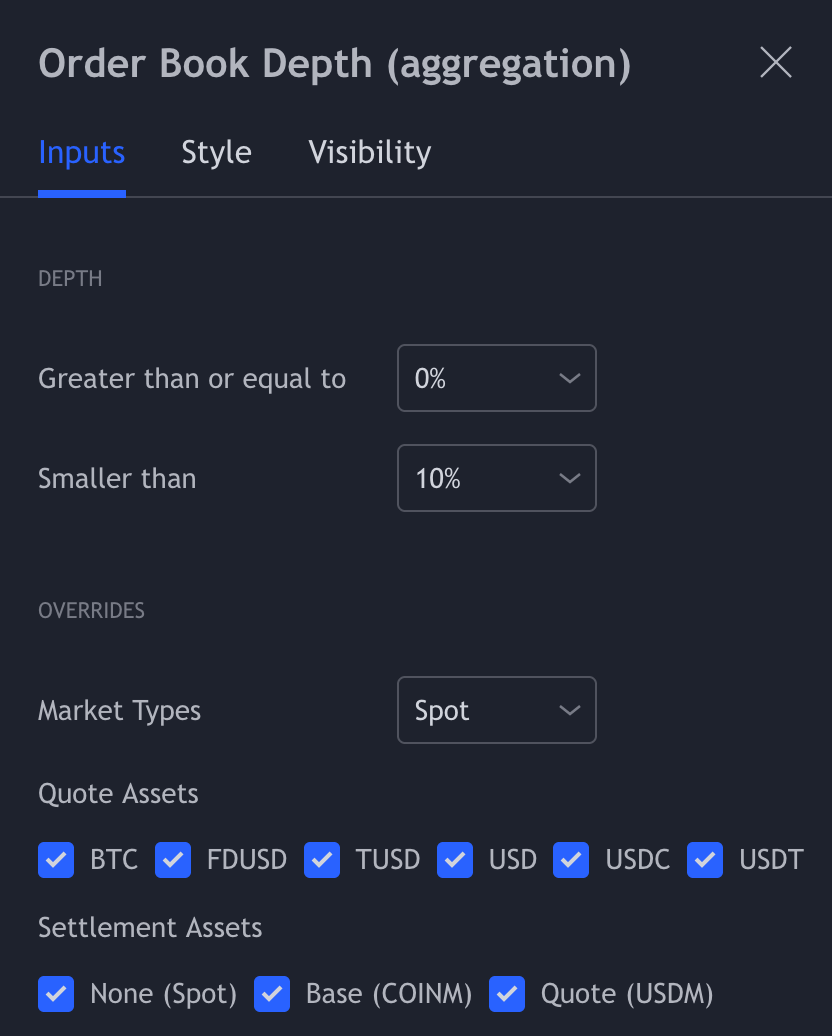
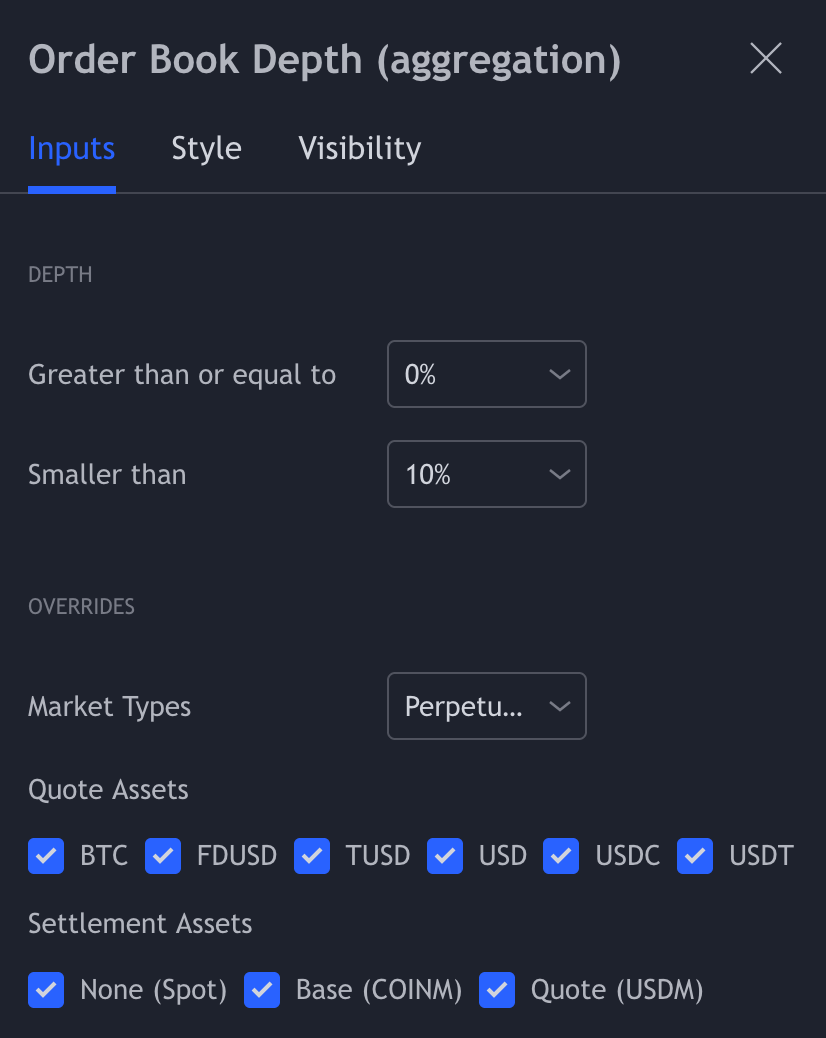
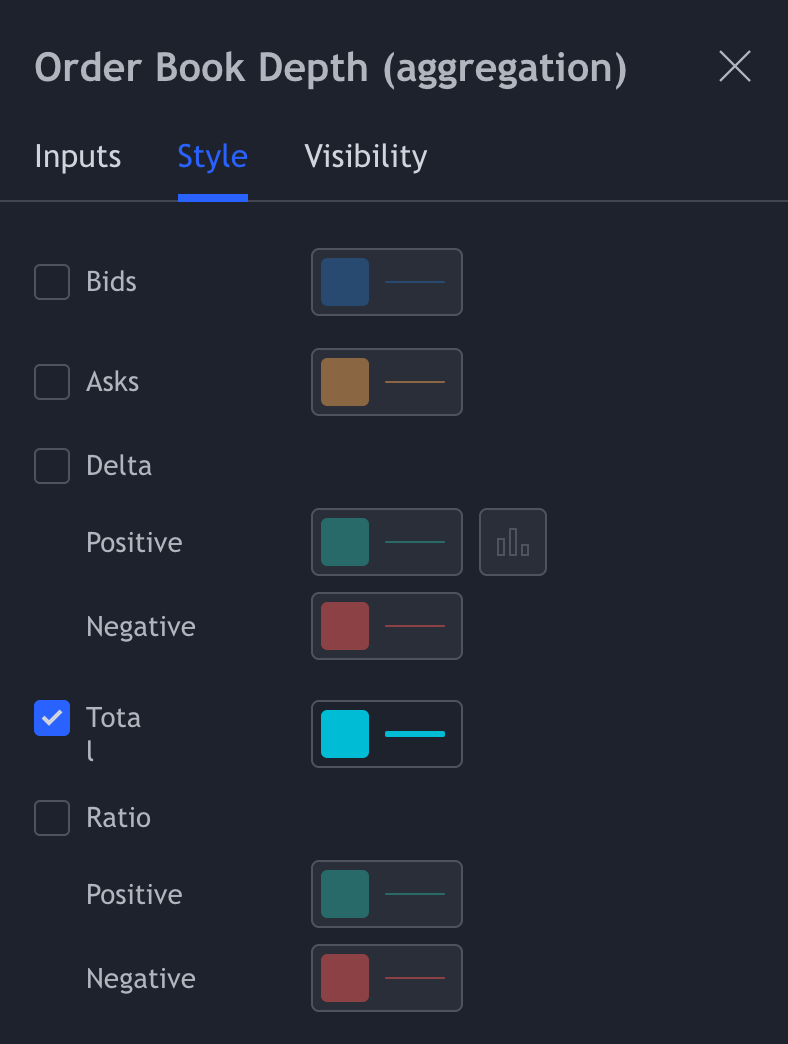
Add the indicator (order book depth aggregation) trough the indicator menu, or use this template link: https://www.trdr.io/u/DK/t/liquidity%20.
Settings 👇
The Edge
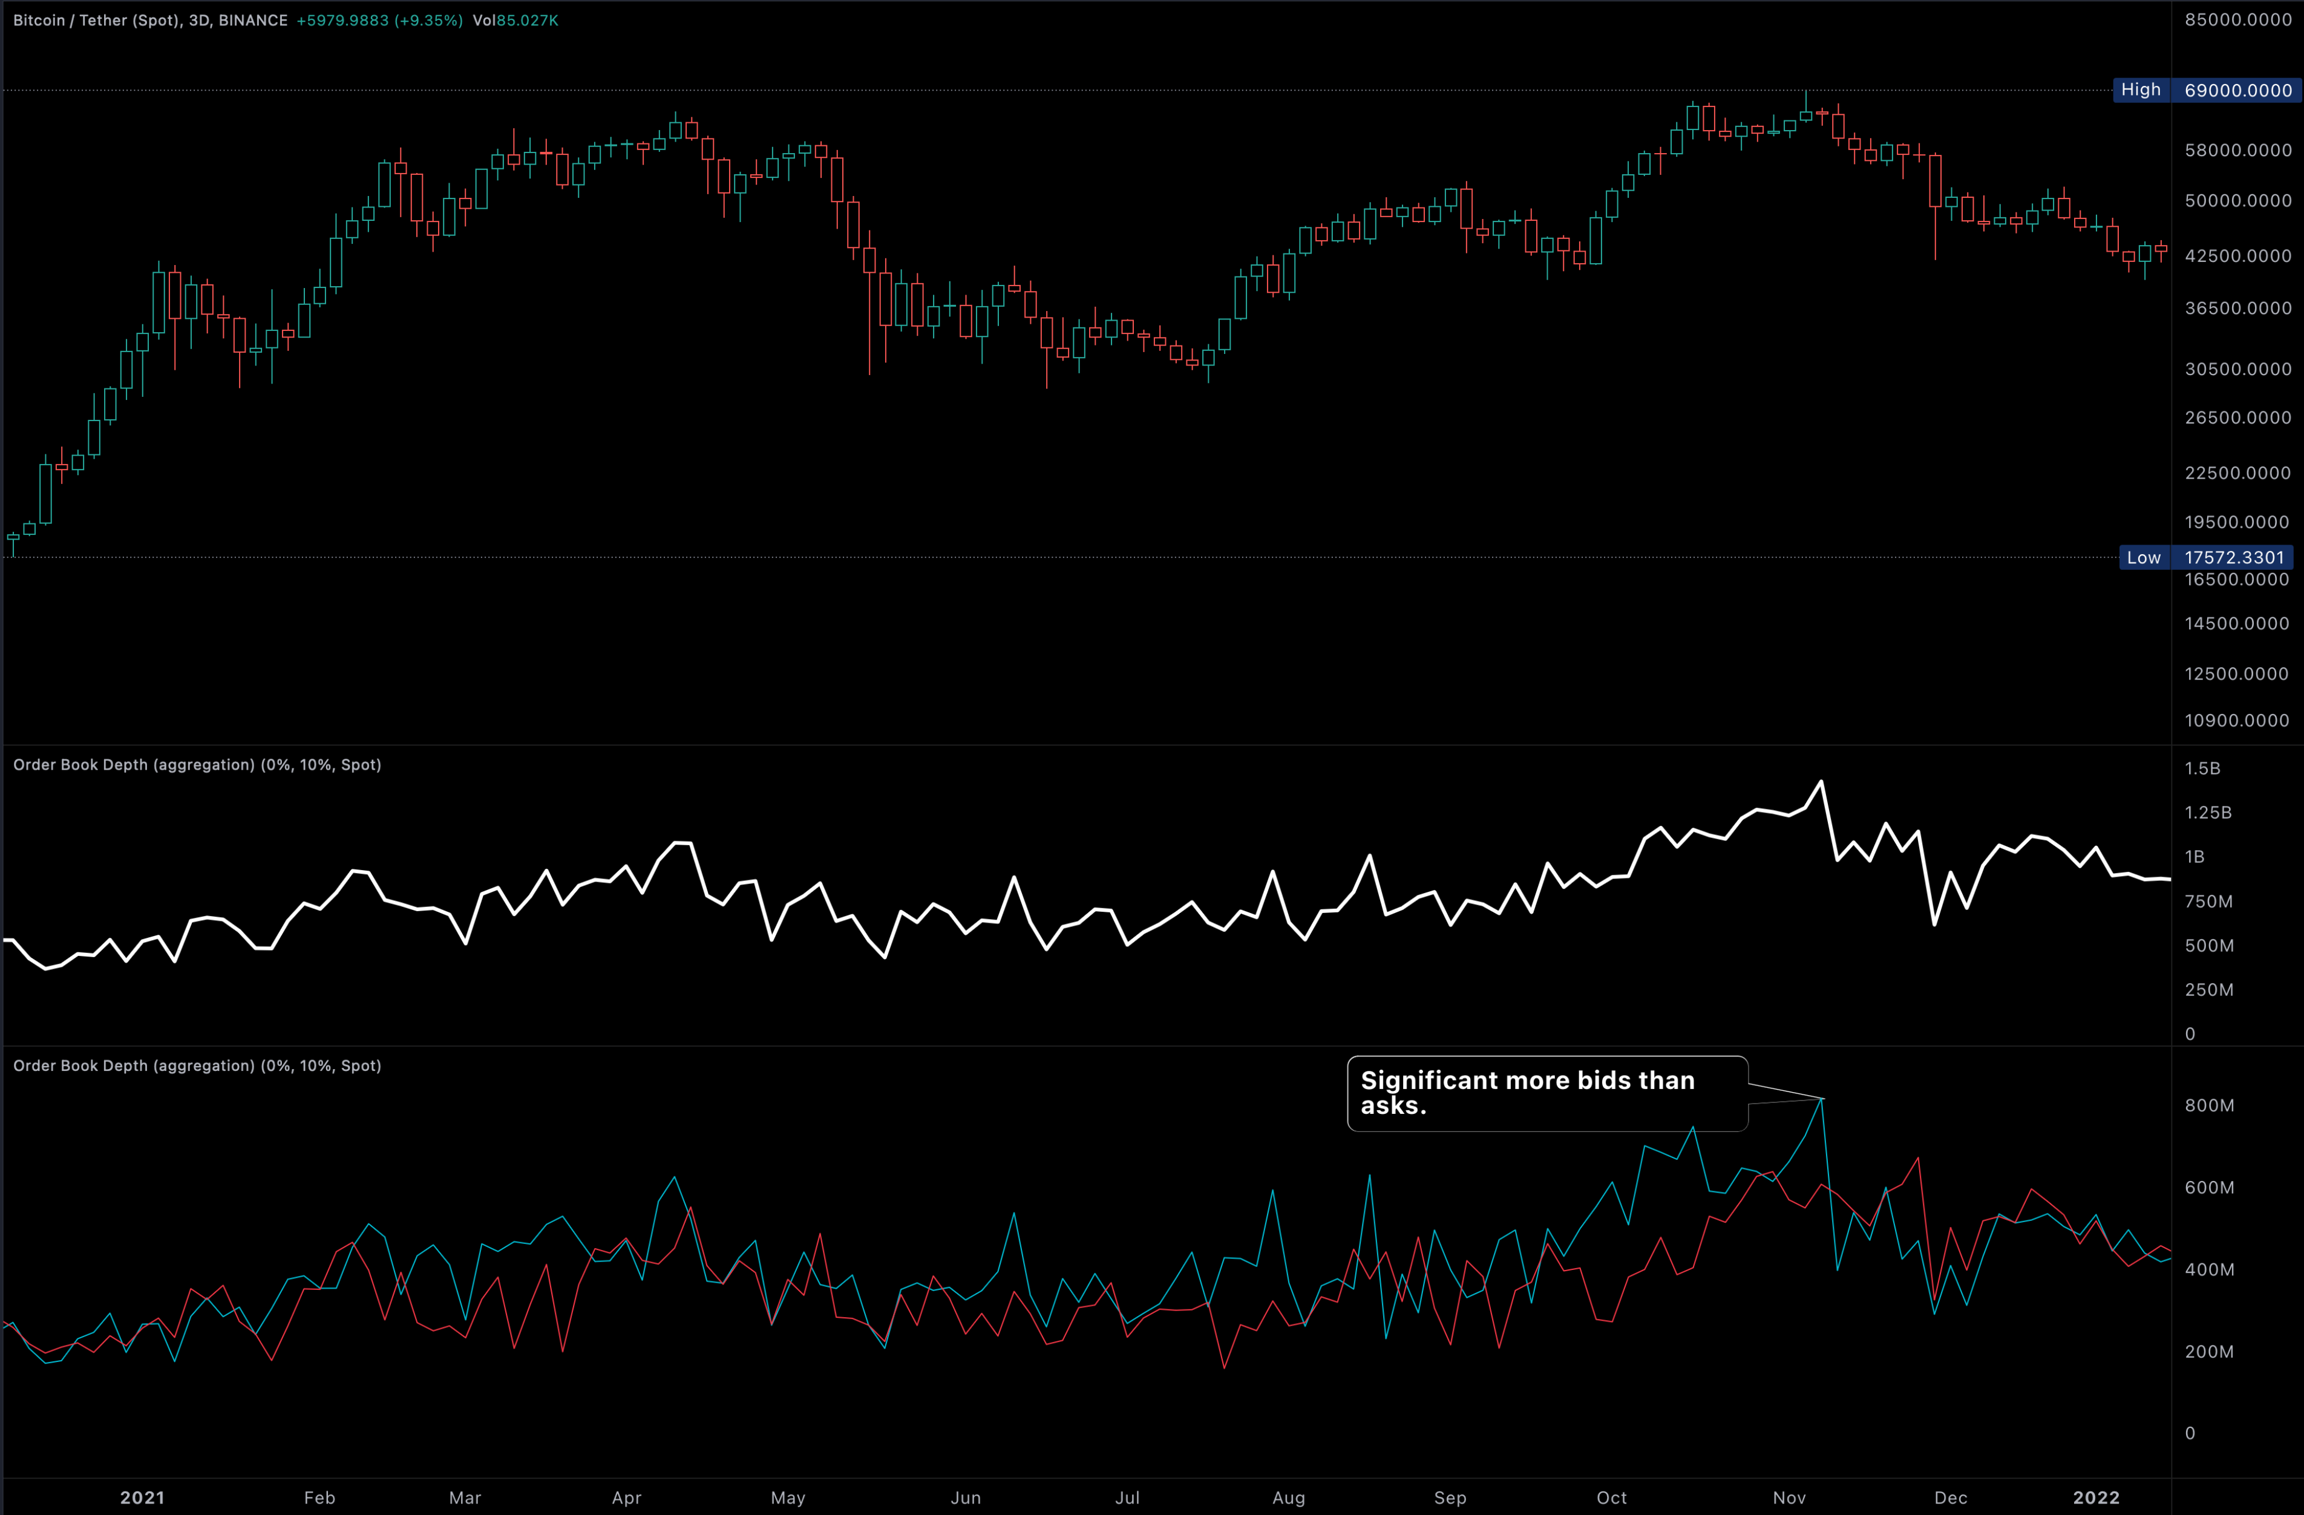
After the first cycle with this new dataset, it became clear that a high value is generally bearish, a low value bullish. Which was a surprise because you would think that more money in the order books is bullish. This could mean that big holders of these assets are selling when the books are thick enough, at the end of the day the biggest whales are making the tops. The ratios are great at measuring the difference between bids and asks, but it says nothing about absolute values. So this became a perfect addition to the overlays and order book depth, giving us traders are more broader view.
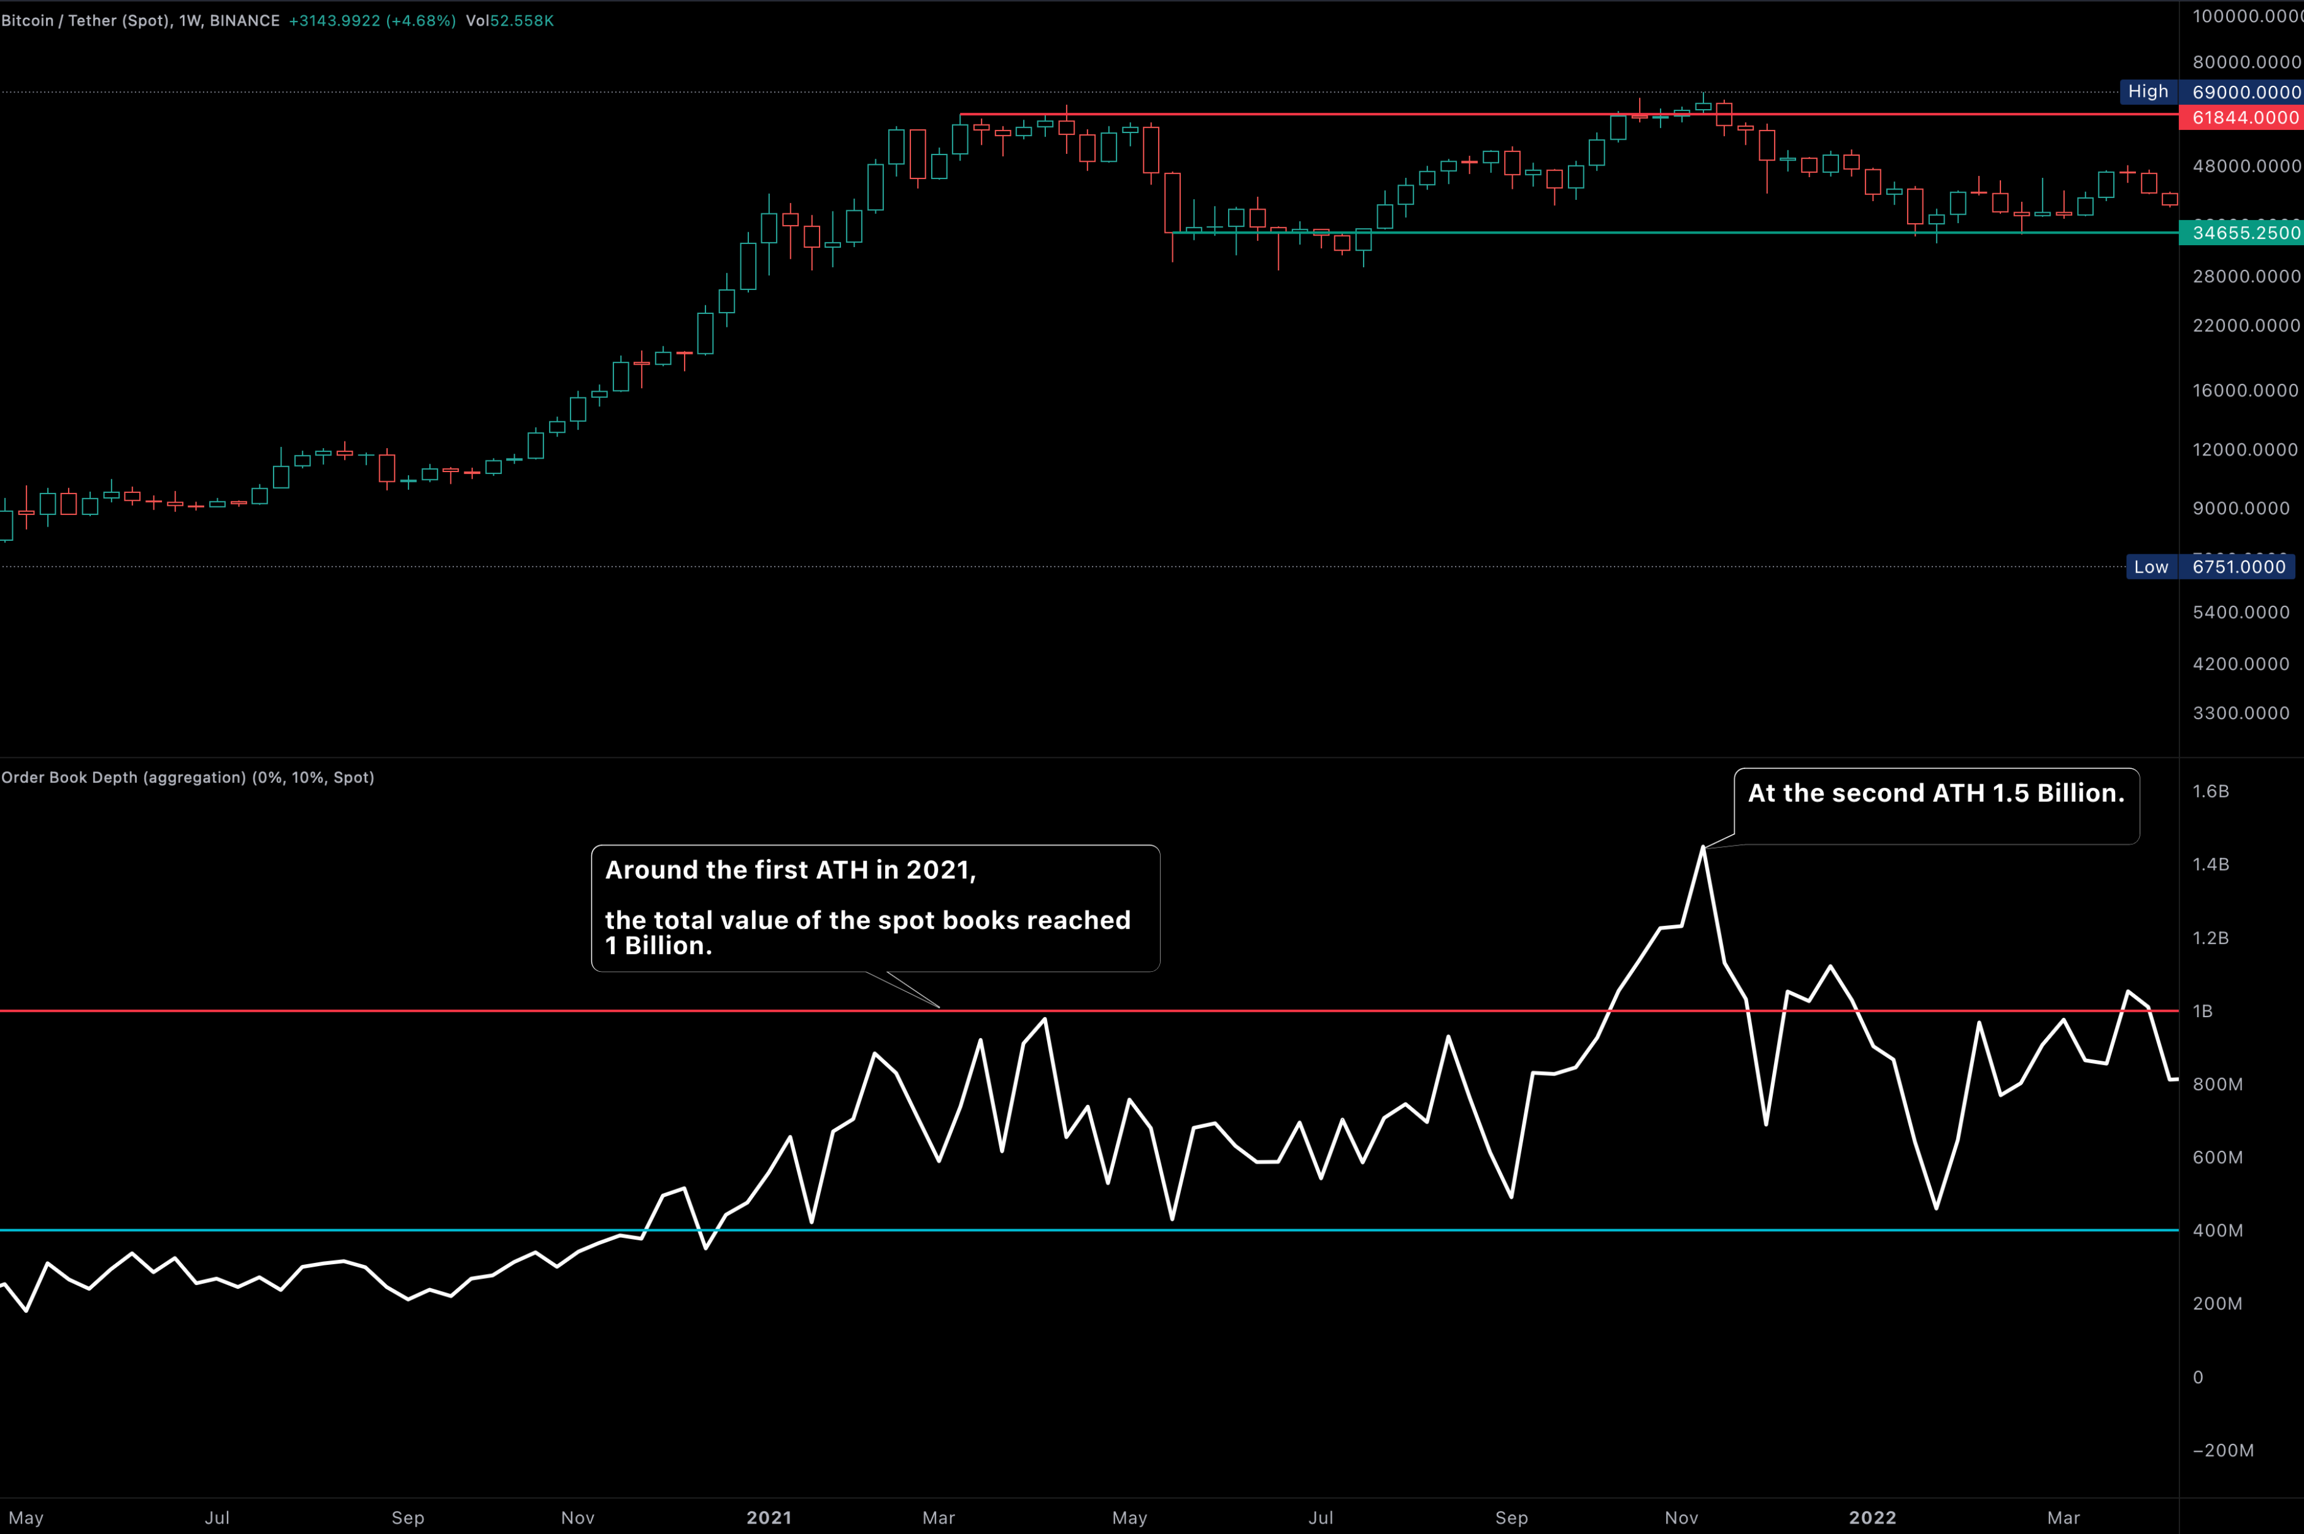
Where there more asks than bids? No in both test of the 60k+ area, there where more bids than asks. Which tells us smart money is waiting for enough liquidity to offload. This does not proof the overlays wont work with calling tops. This form of the order book depth is cumulative, the overlays are non cumulative. The overlays showed clear signs of sell pressure at that time.
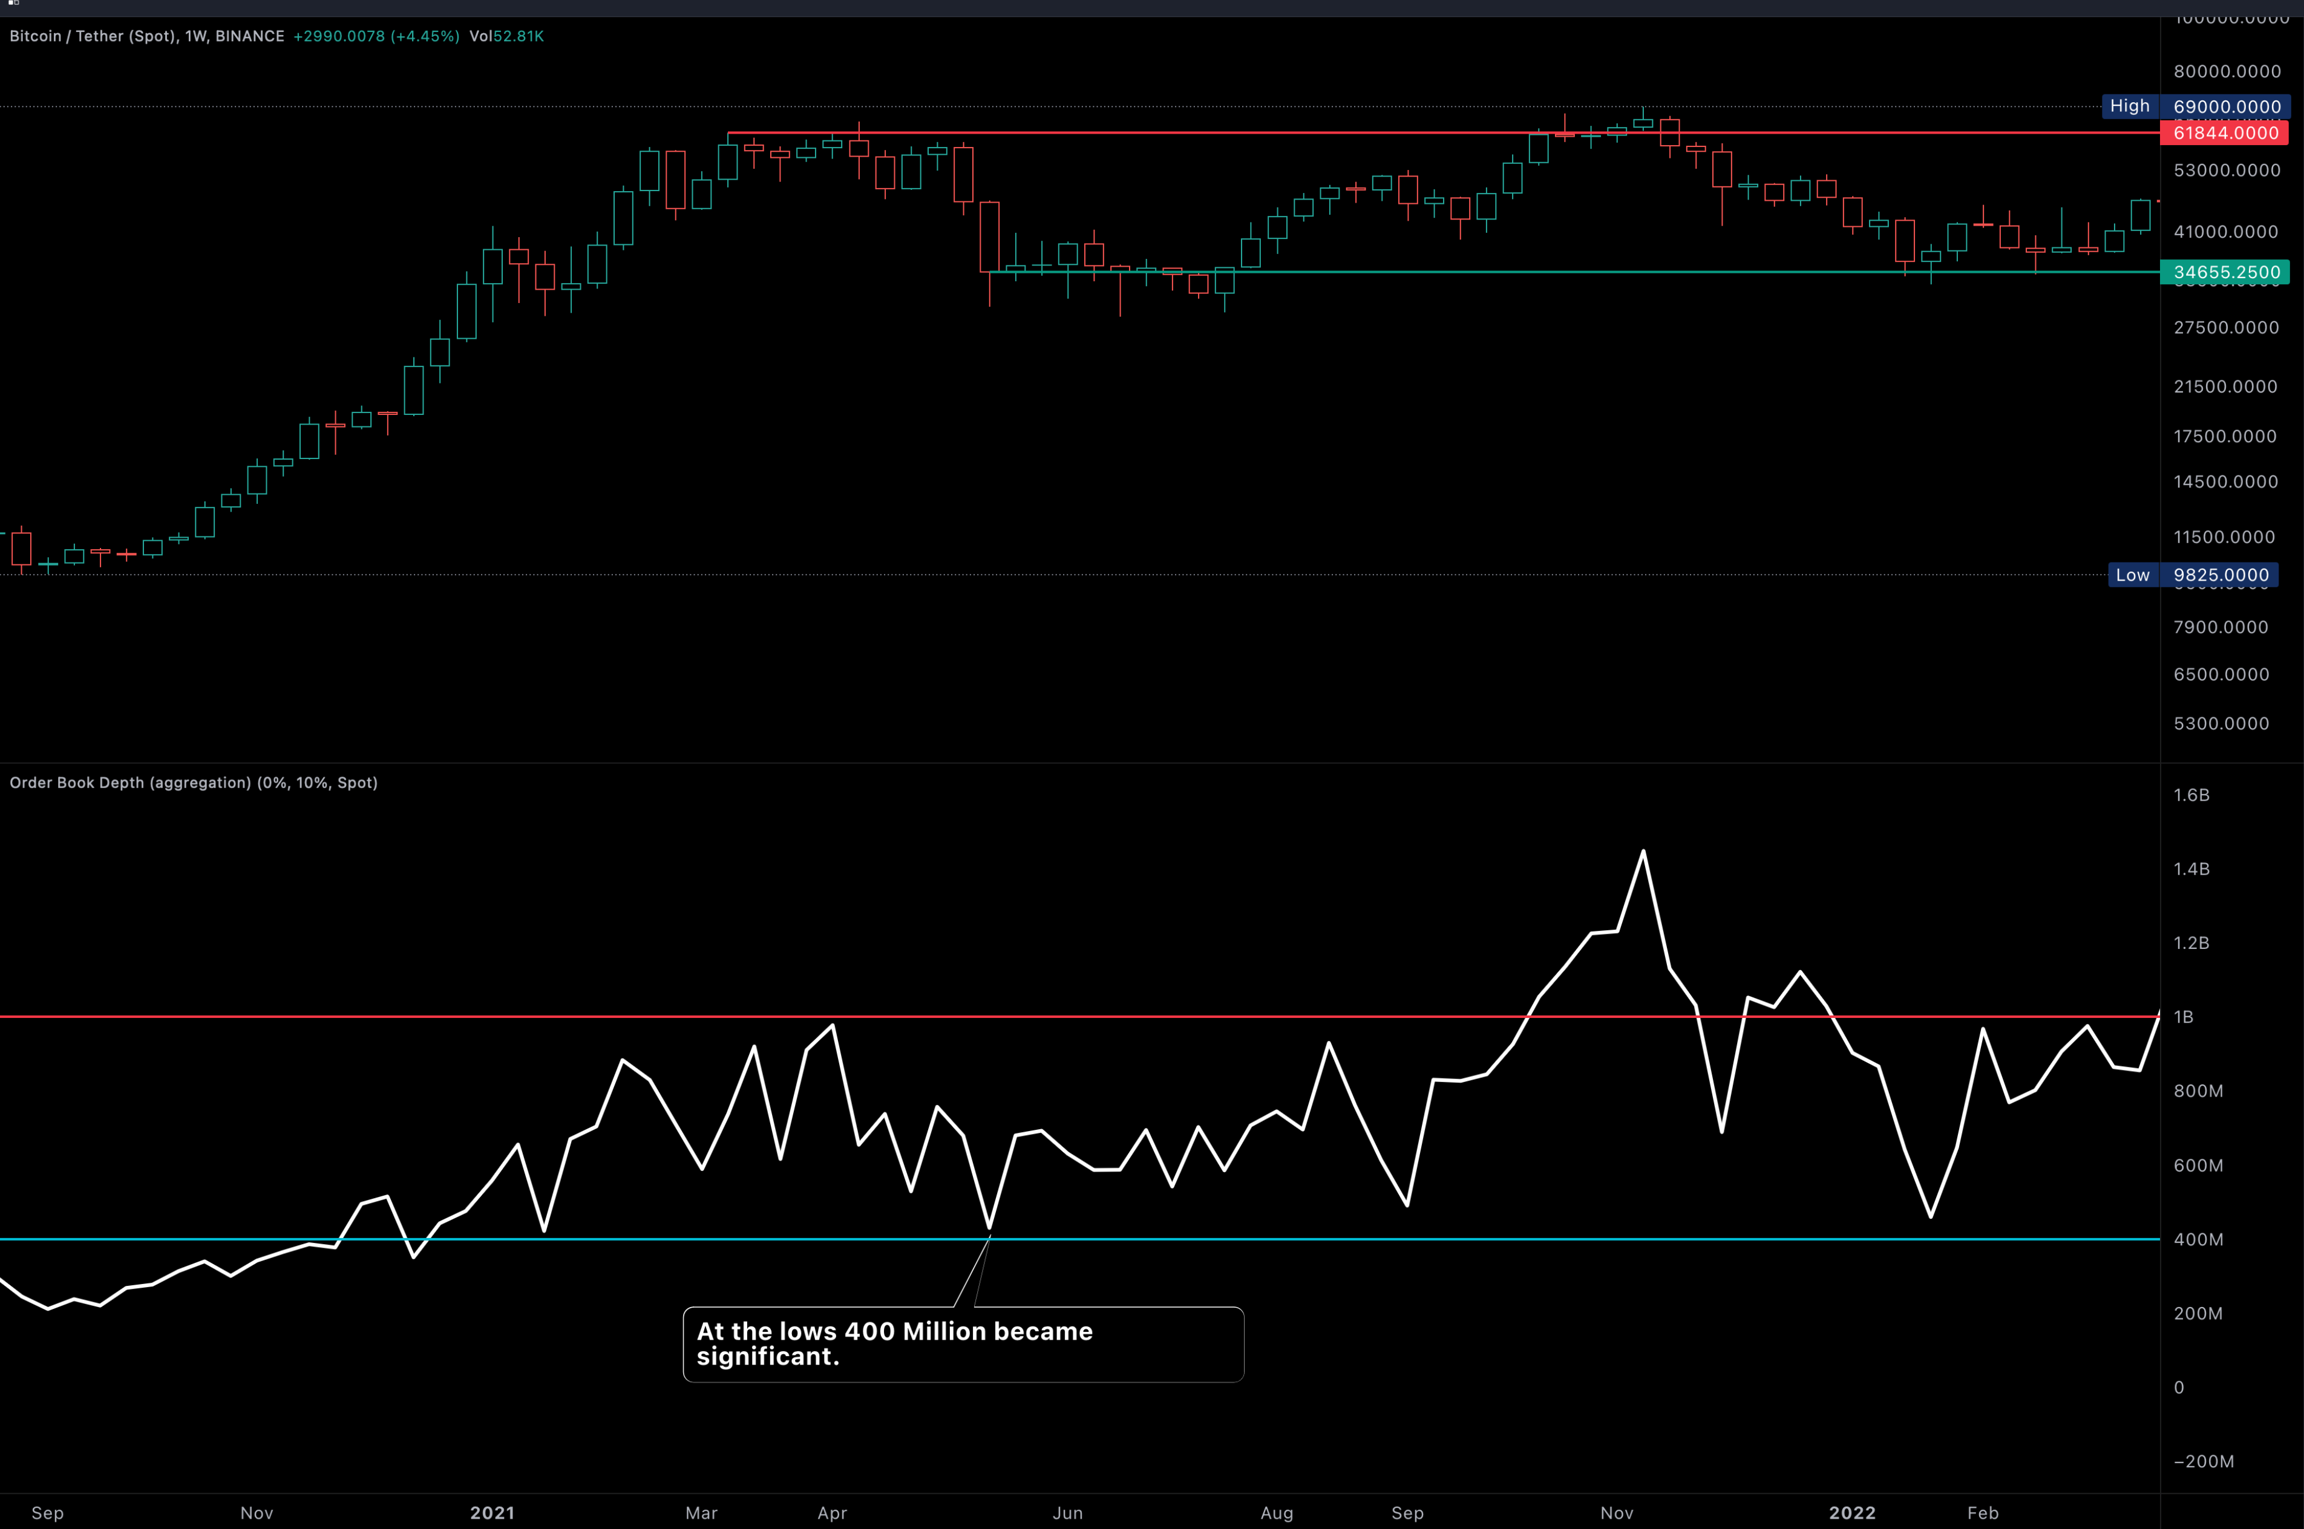
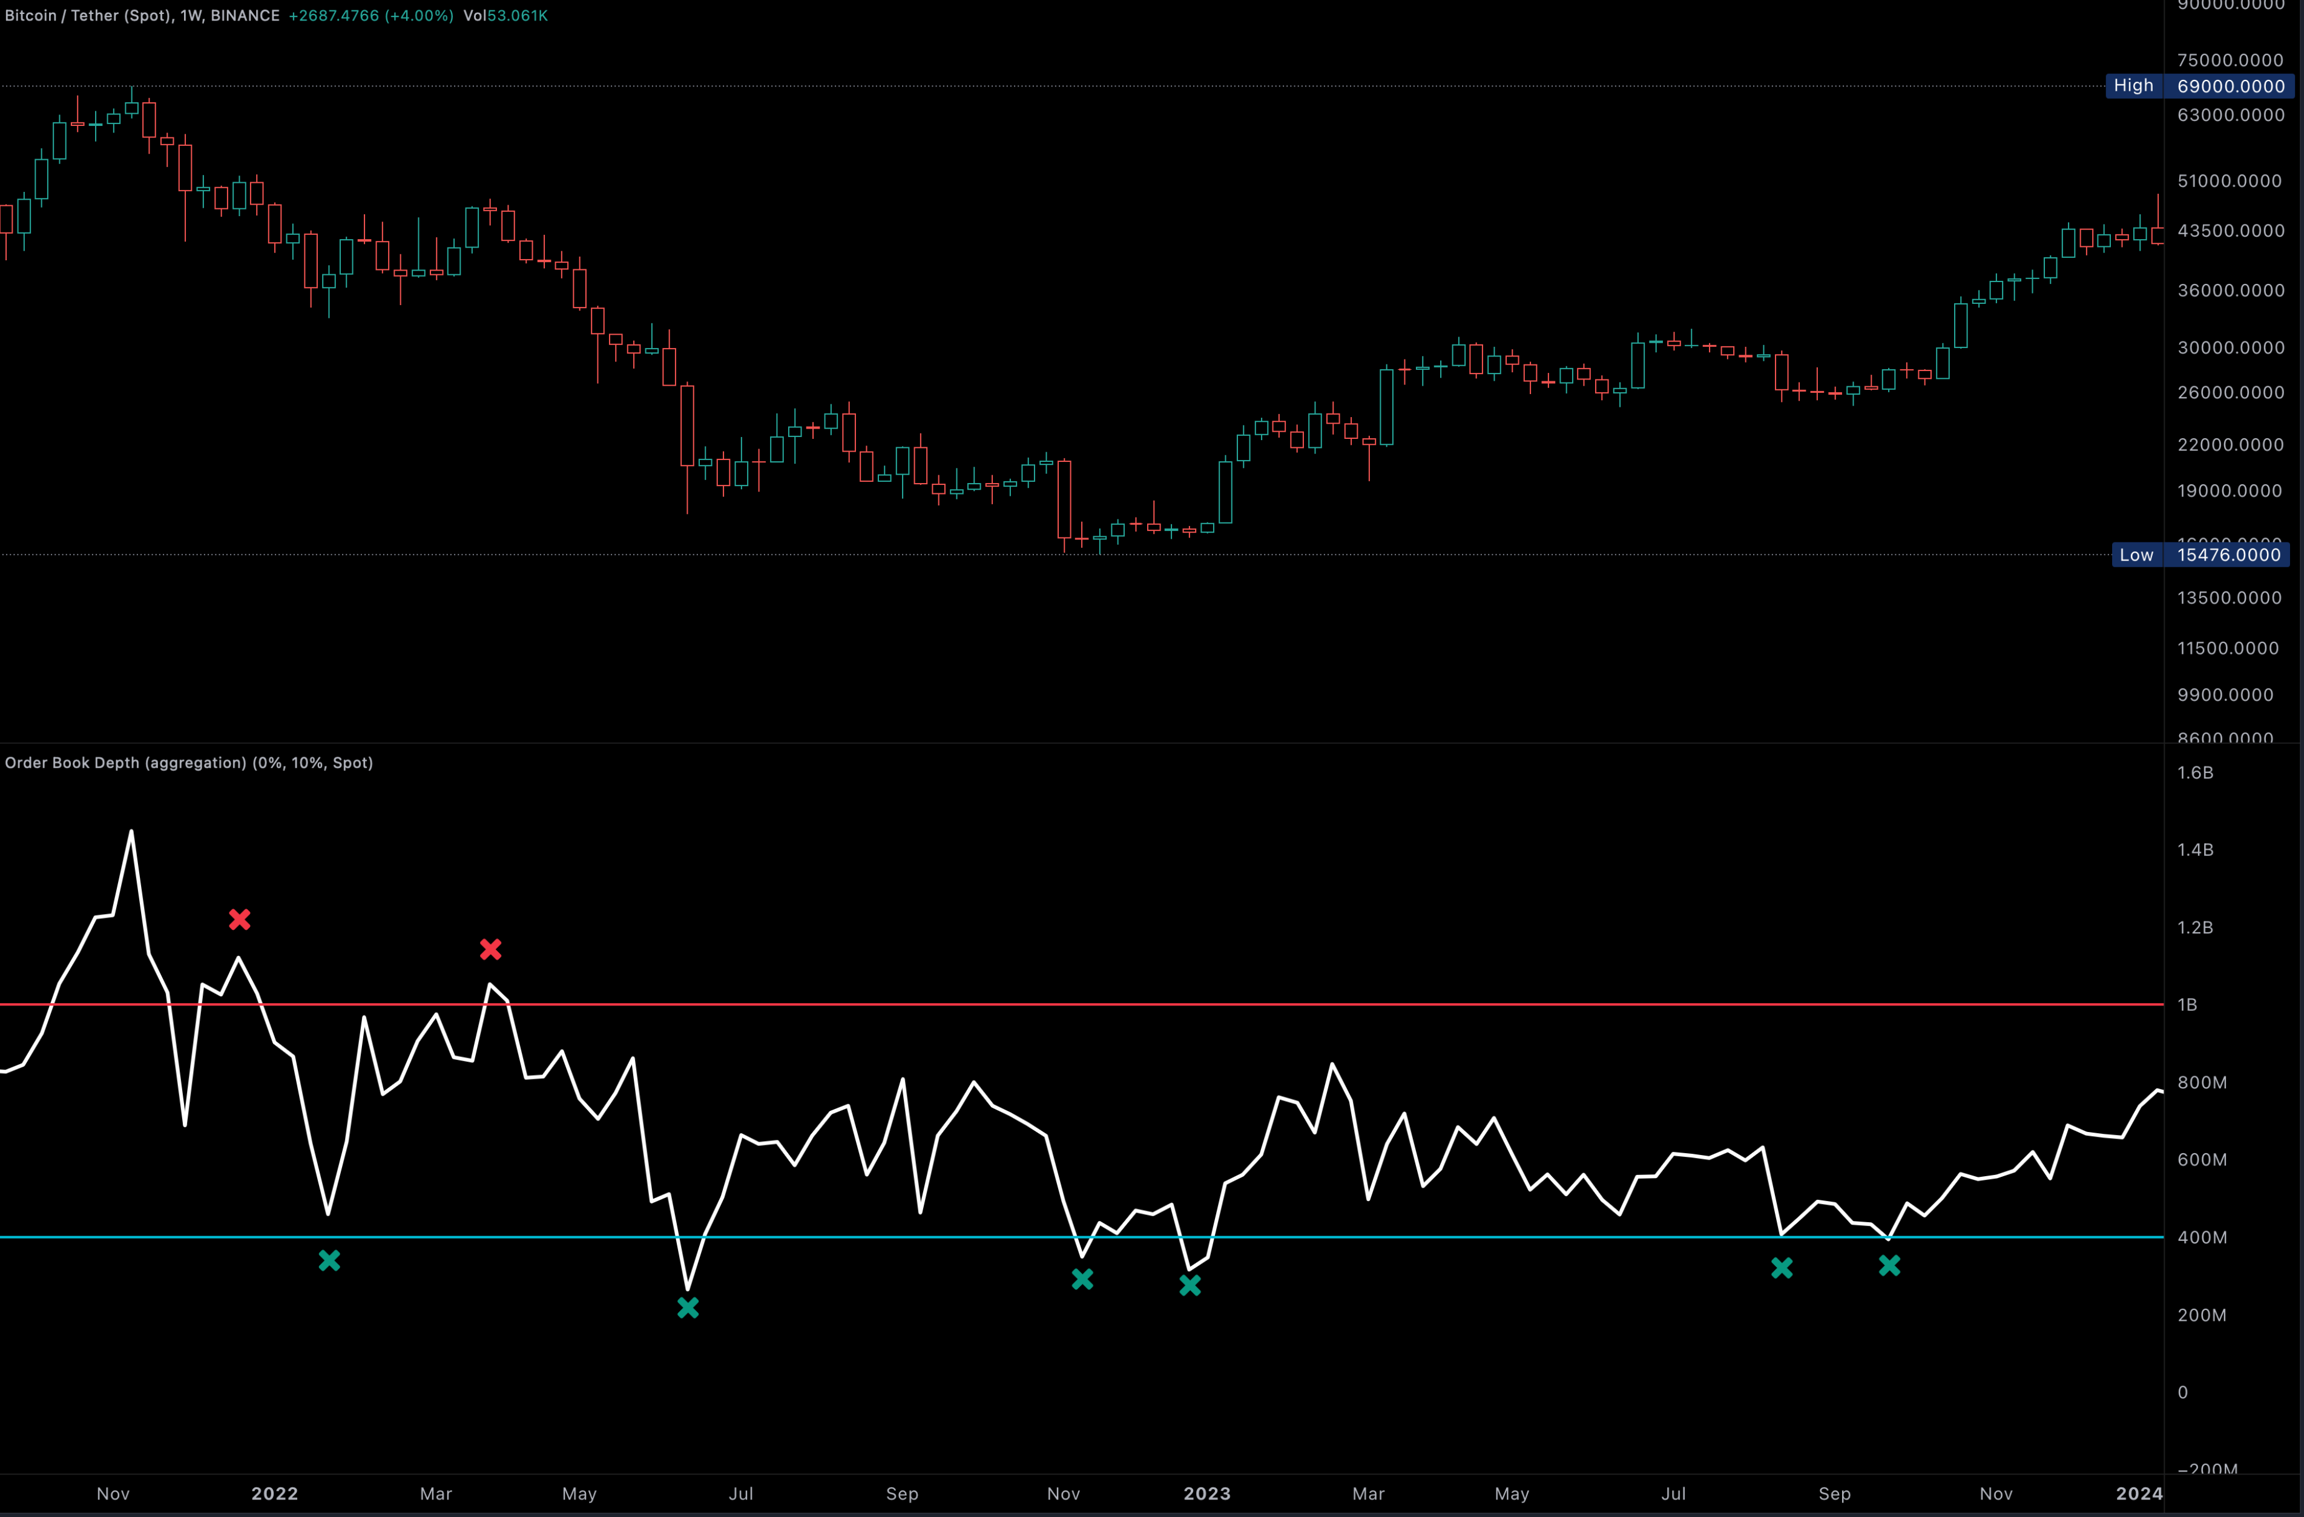
This was the first bull cycle, lets analyze the first bear market with this data.
The values proved to be significant, below 400 million was value and 1 billion significant resistance.
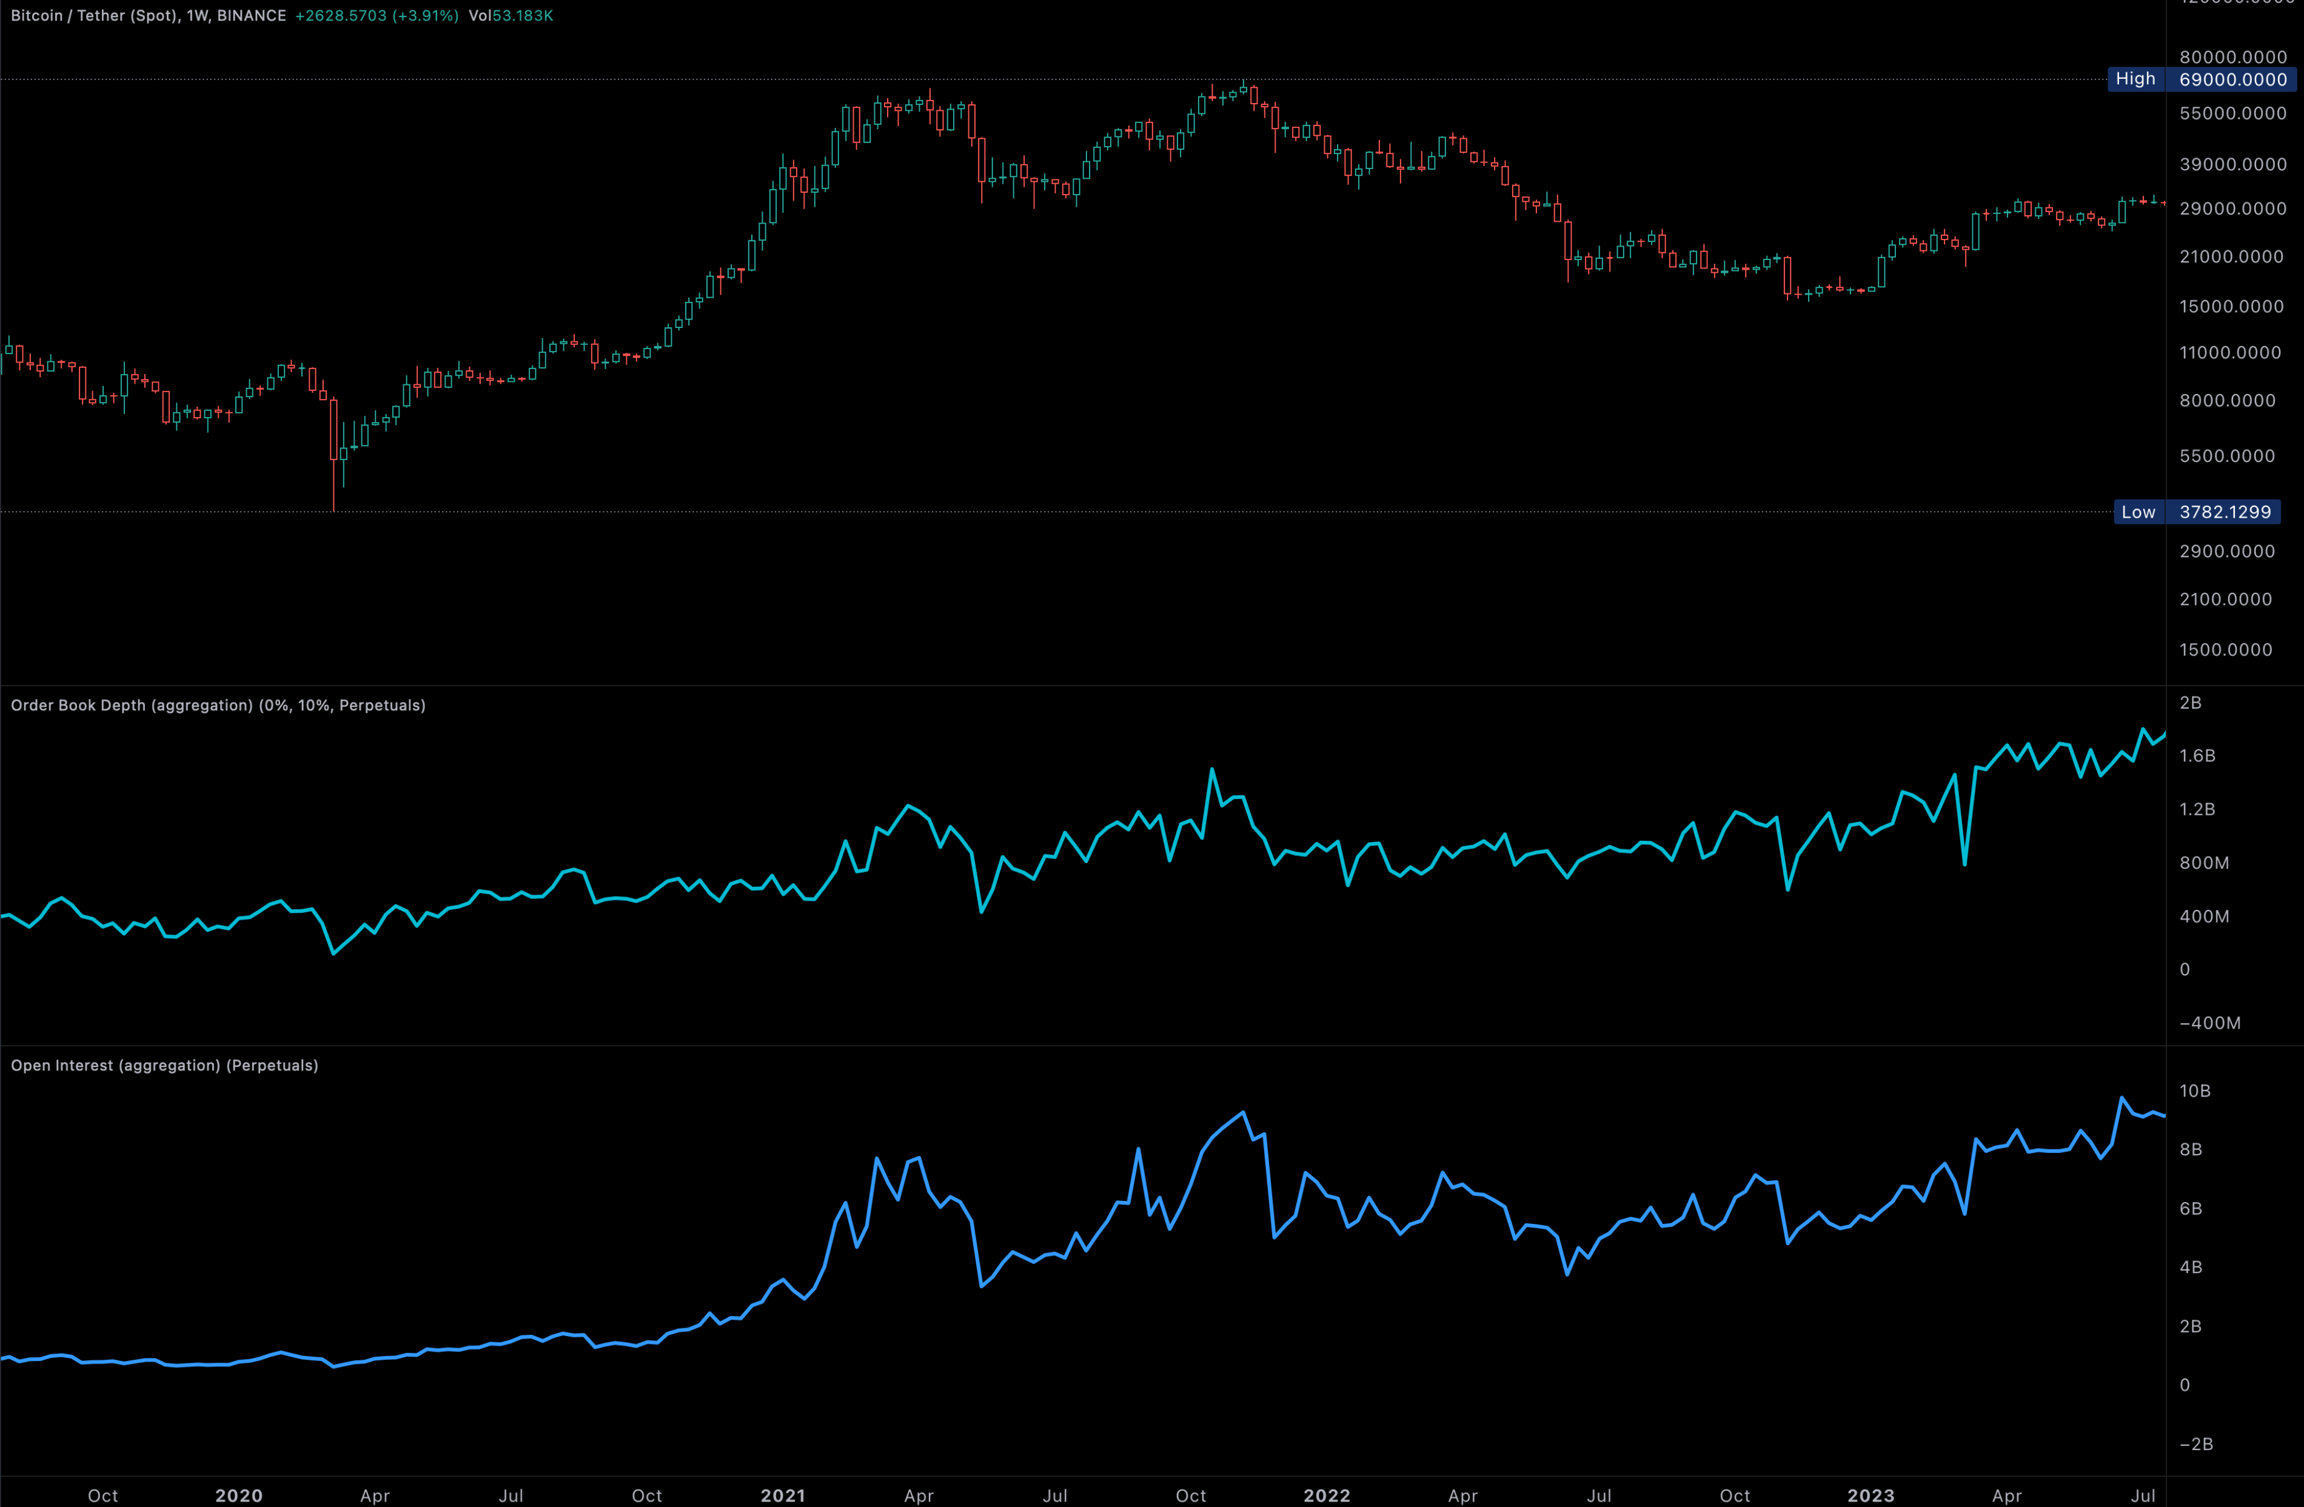
So what about Perpetual order books? They are less significant because there will be liquidity added according to the open interest. Meaning if the price drops and lots of shorts chase the price, market makers will provide liquidity accordingly to the open interest. As we can see in the image below.
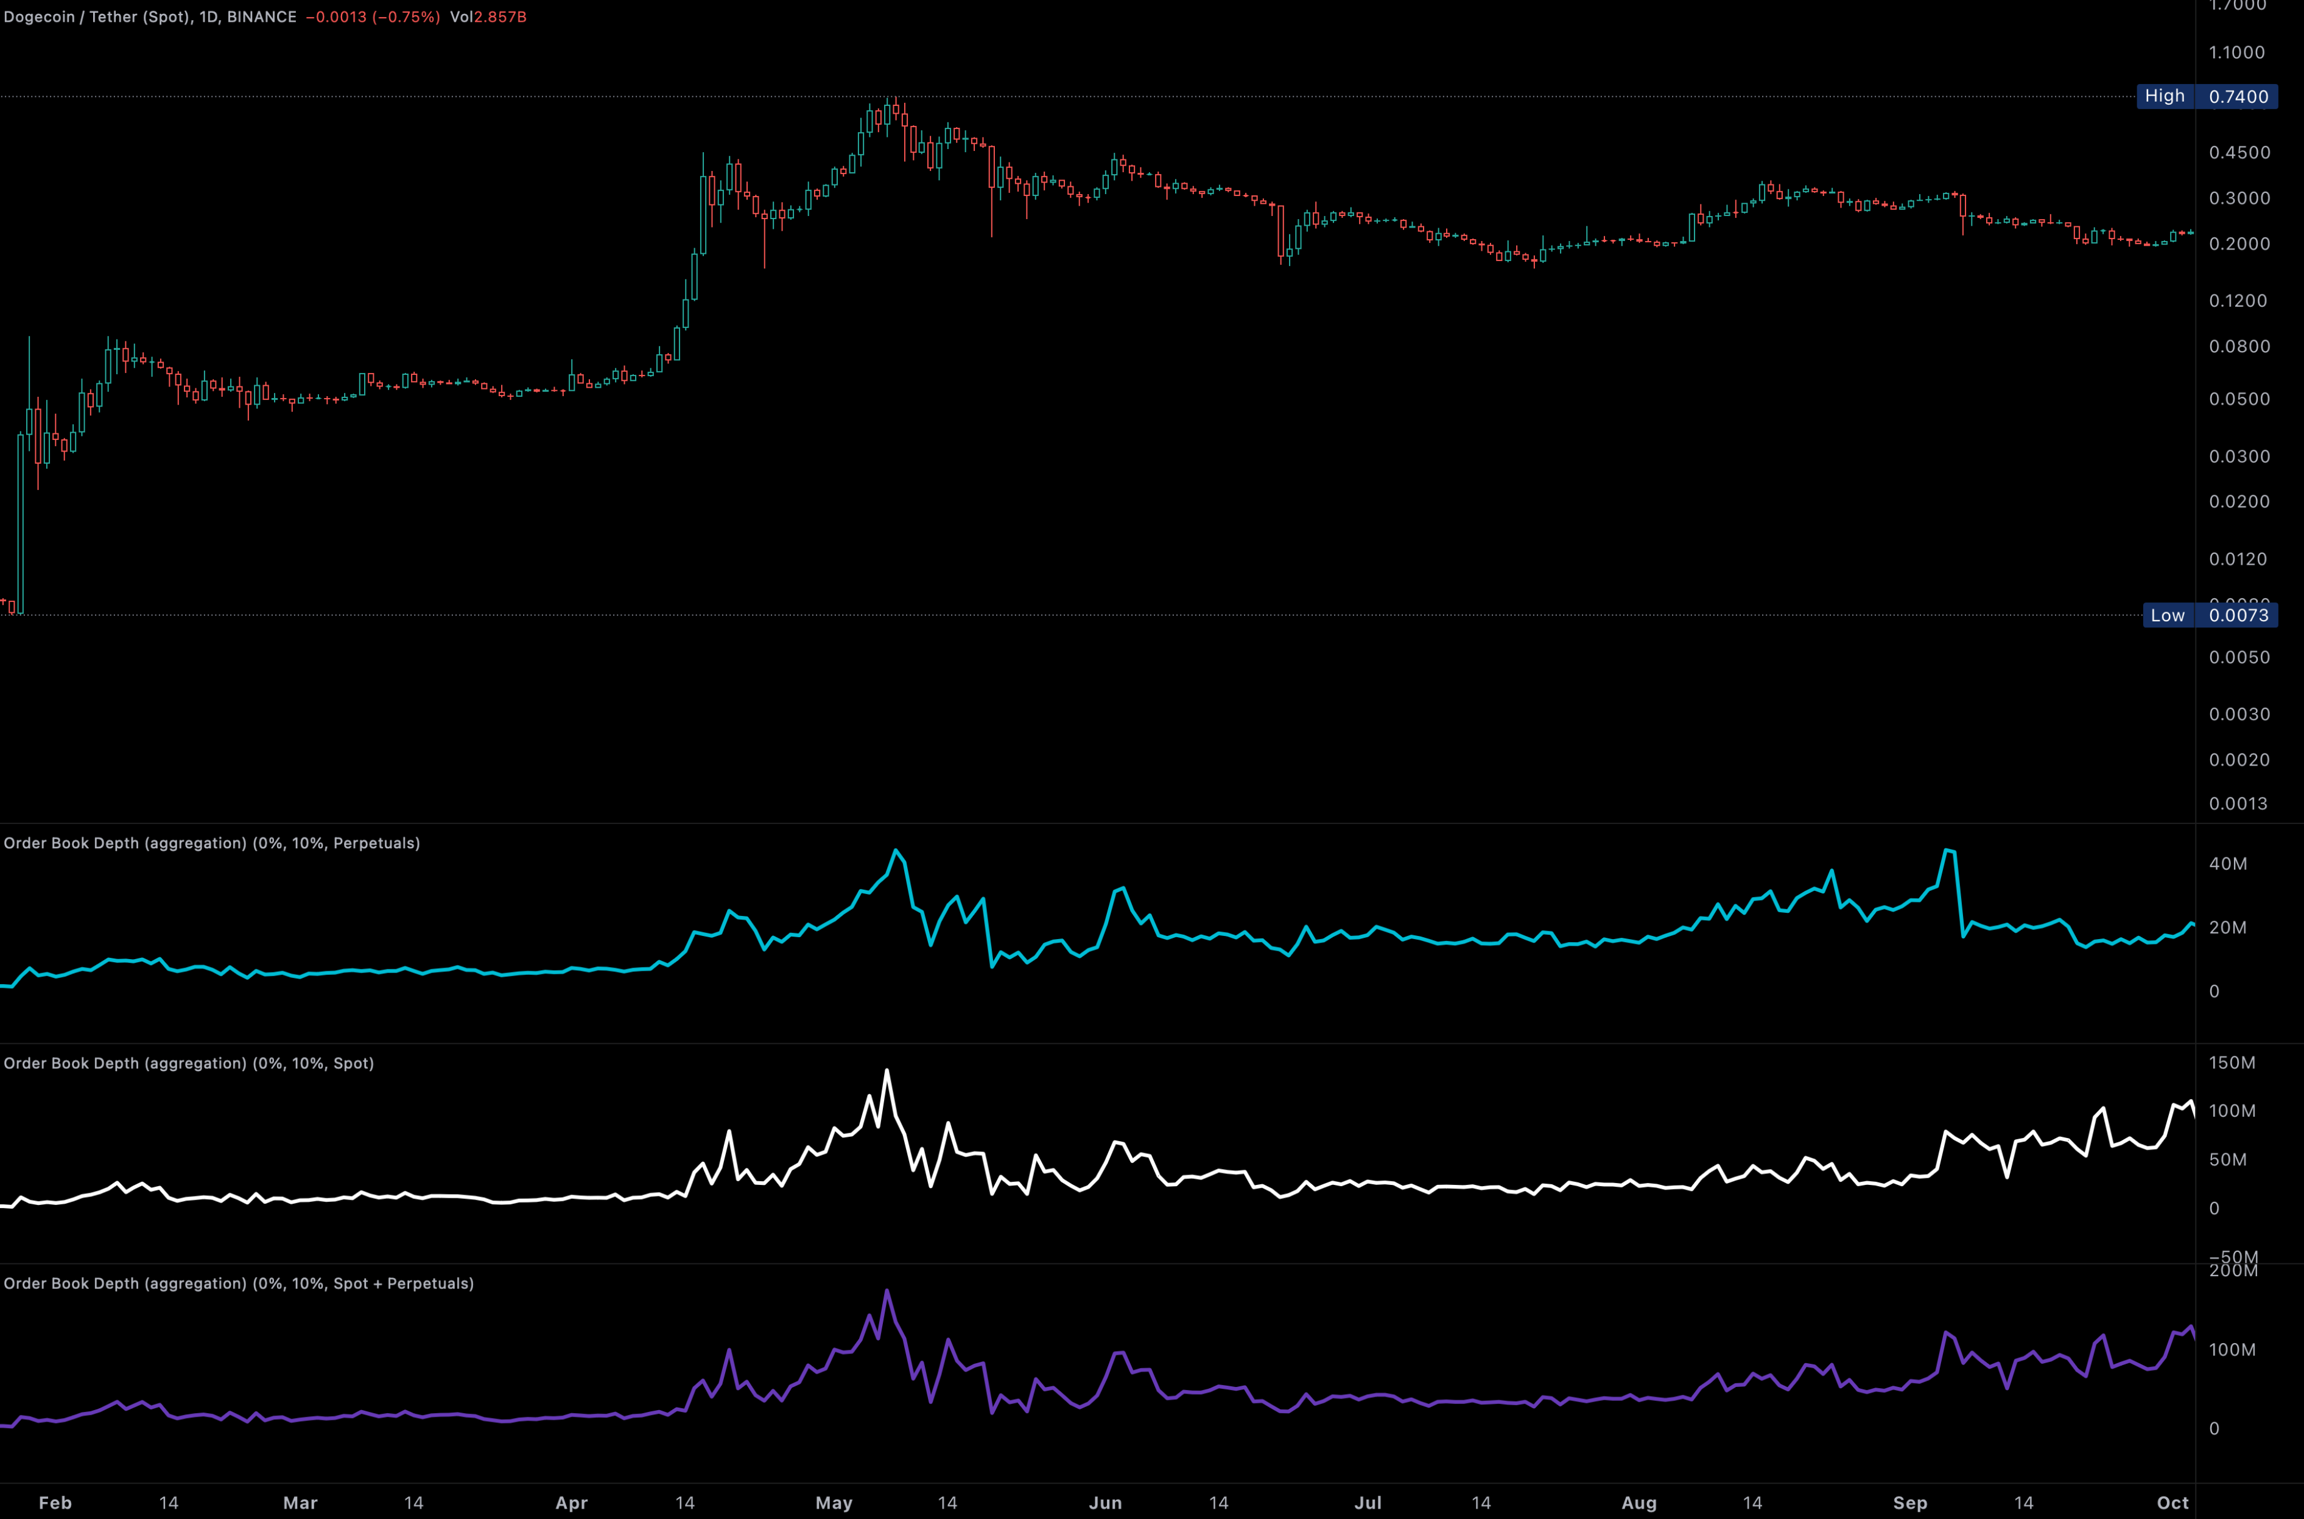
This dataset also works for alt-coins but can take longer to play out. Below a DOGE / USDT liquidity chart, as soon as the totals began the rise significantly it was due for a pullback.
Liquidity Changes
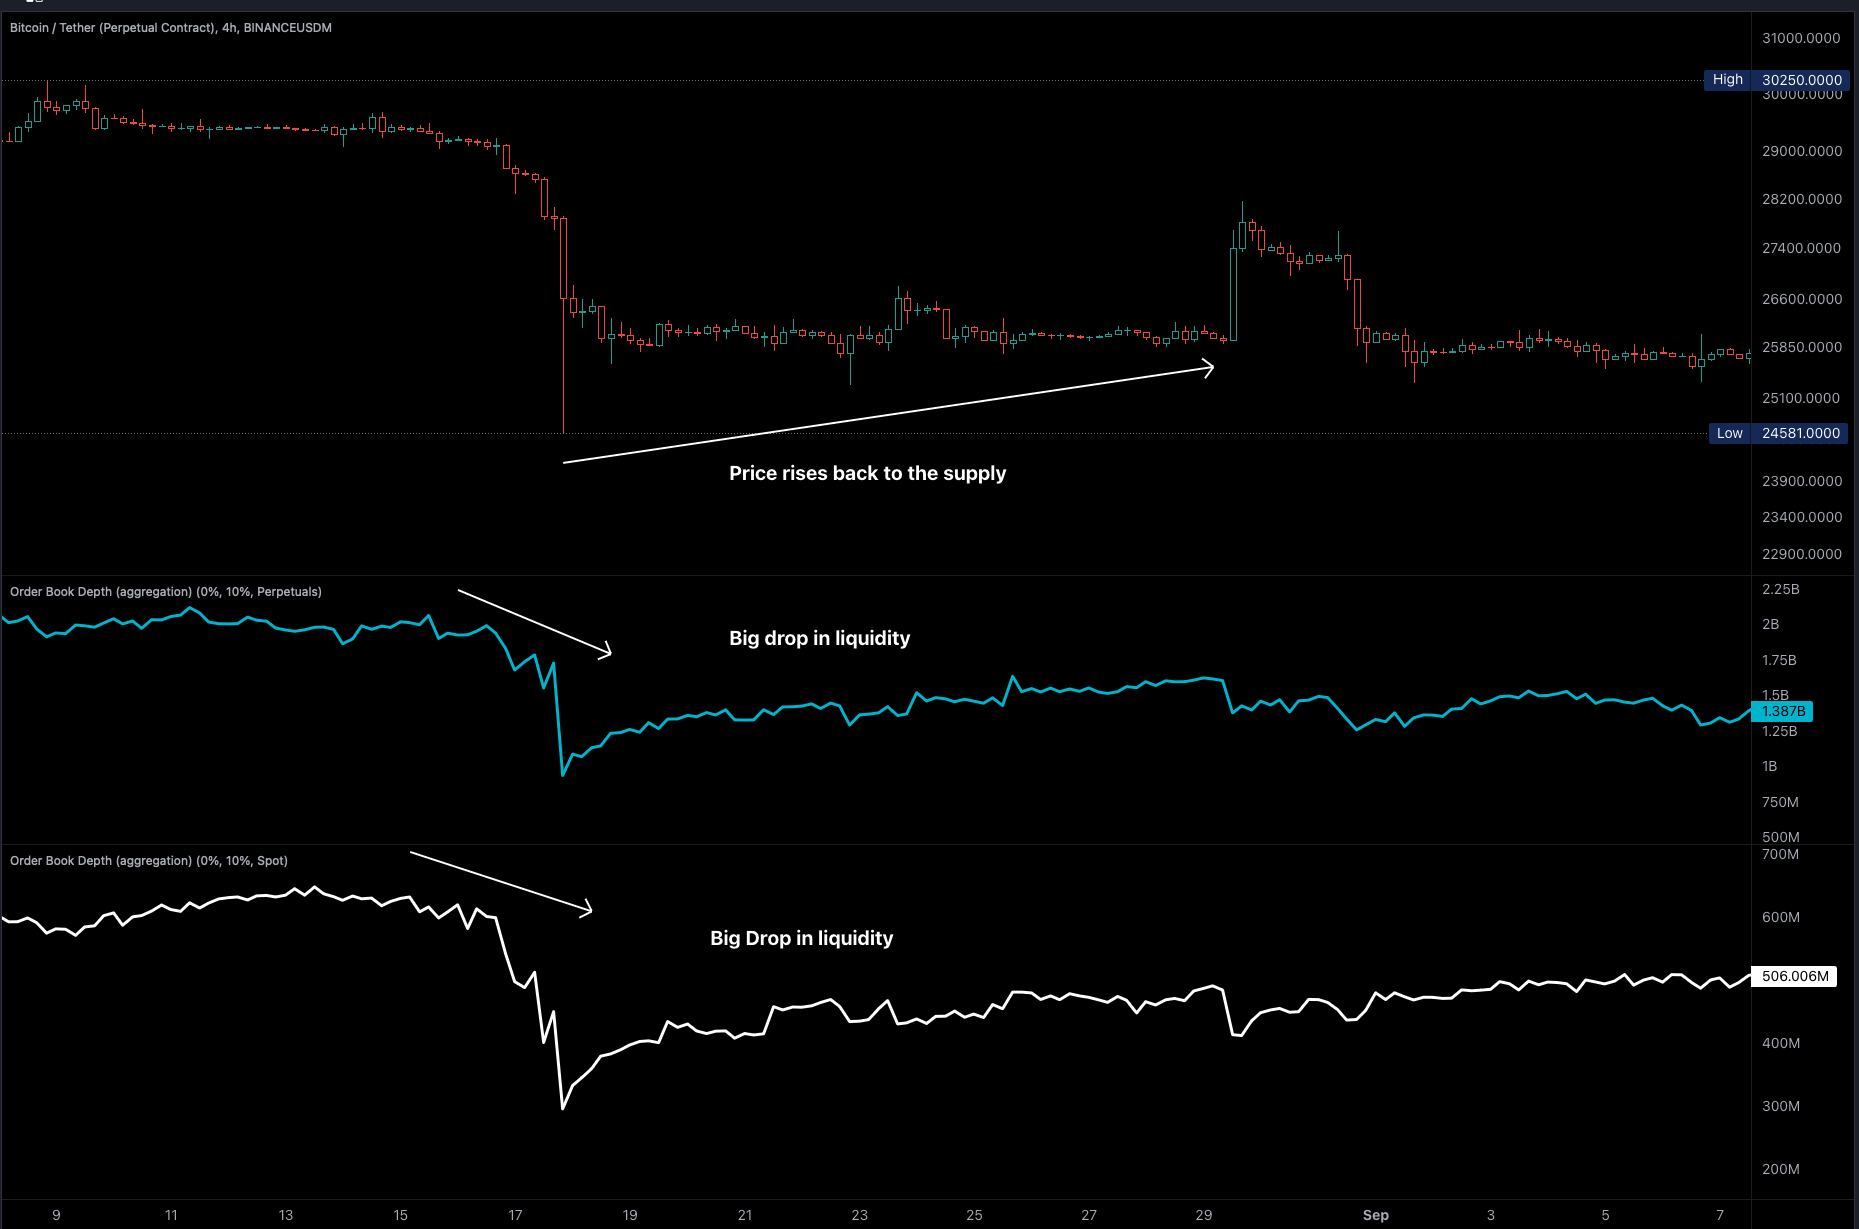
Another useful way of using this data, is monitoring the drops in liquidity. The concept is simple, we monitor for big changes in the totals of the order book depth totals. A big decrease = generally bullish a big rise bearish, but there will also be scenarios where the opposites occur. The golden rule = in both scenarios price will reverse. If price rises and liquidity drops a pullback (and the other way around) is likely because the books are getting empty. So price needs to come back to the demand or supply. Lets look at some big drops on a high time-frame.
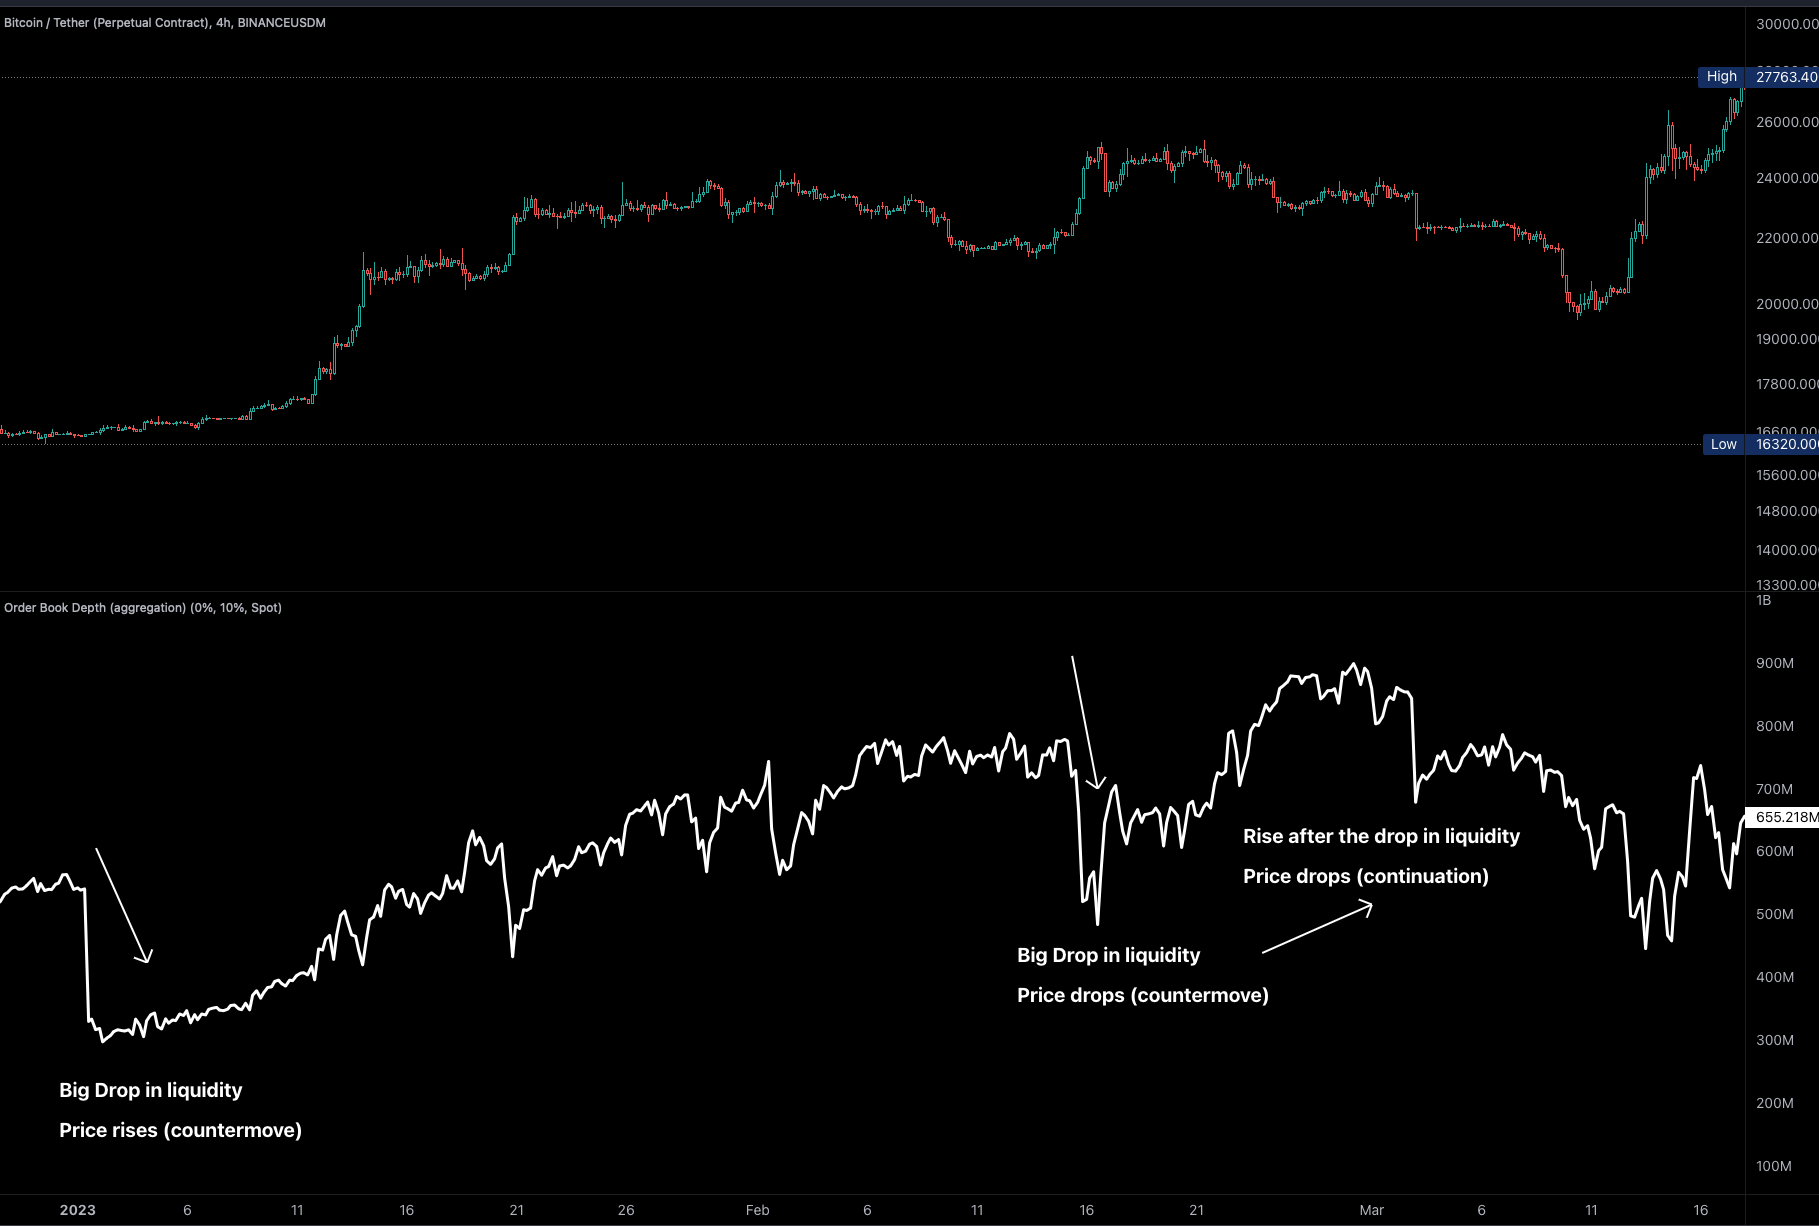
The second example is more complex, we got a normal drop in liquidity with a countermove. And a situation where the liquidity rose after a drop. But as mentioned earlier an increase in liquidity is generally bearish.
Conclusion
At TRDR, our team spent extensive time refining this data to extract its definitive edge. After multiple market cycles, it became evident that tracking order book liquidity as a whole provides traders with a deep insight into market conditions, institutional activity, and overall liquidity trends.
By integrating the Order Book Depth Indicator with Top Levels and Open Interest, traders can develop a comprehensive liquidity-based trading strategy, gaining a real competitive advantage in the market for the ultimate execution and risk reward.

