

Volume By Side
The Volume by Side indicator on TRDR provides a detailed breakdown of buy and sell volume, helping traders identify market imbalances and divergences.
Functionality
Splitting Buy & Sell Volume – Buy volume (green) is displayed above the zero line, while sell volume (red) appears below it.
Total vs Delta – By default, only the difference (delta) between buy and sell volume is shown, but users can enable total volume visualization.
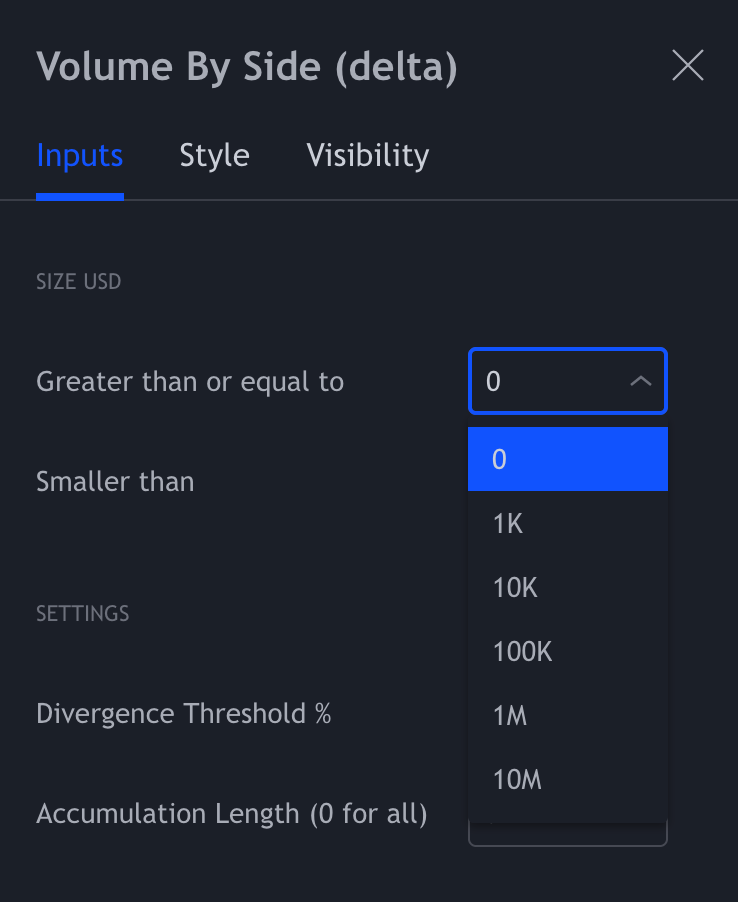
Trade Categorization by USD Value – Every trade is grouped into categories based on size, allowing for filtered analysis.
Volume Divergences & Market Insights
A volume divergence occurs when trading activity does not align with price movement.
For example:
If sell volume exceeds buy volume, but the price closes higher, it may indicate hidden buying pressure.
Conversely, if buy volume dominates, yet the price closes lower, sellers may still be in control.
Custom Divergence Thresholds % – traders can set a minimum volume difference percentage (e.g., 10%) to filter out weak signals and highlight only significant divergences.
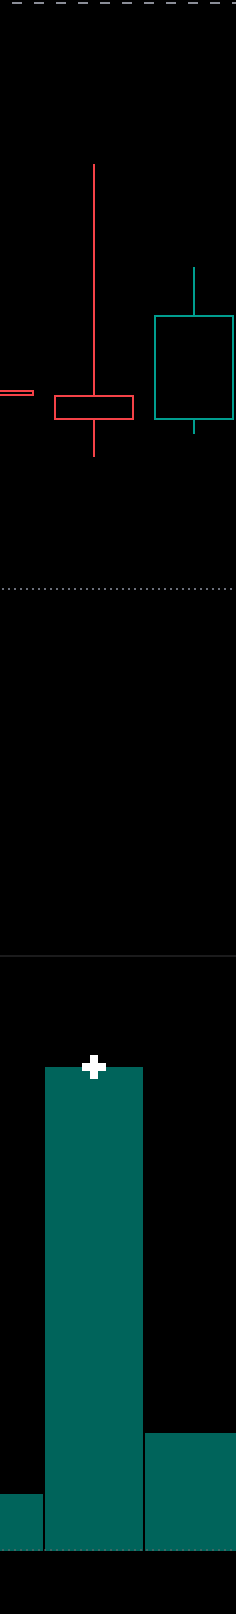
In the example above we see a volume divergence, positive volume on a red candle.
Last updated